
Millions of American homes still get drinking water through pipes that may contain lead. The problem is that no one can see those pipes without digging. They are buried under lawns, sidewalks, and streets, and city records about them are often missing or wrong.
Lead service line prediction AI offers a practical way to narrow the search. It ranks addresses by likelihood of lead, so crews dig first where lead is most likely. A prediction is still only a guess until a verification dig confirms the pipe material in the ground.
What a Service Line Inventory Is
A service line inventory is an official list of what every drinking water service line is made of. A service line is the small pipe that connects a home or building to the larger water main under the street. Each entry is classified as lead, galvanized requiring replacement, non-lead or unknown.
Galvanized requiring replacement, often shortened to GRR, means an iron or steel pipe that may have trapped lead from upstream sources or from a former lead section. Unknown means the utility does not yet have enough evidence to classify the material. Reducing unknowns is now a central task for water systems across the United States.
The scale is large. The American Water Works Association estimates that up to 10 million lead service lines remain nationwide, with replacement costs approaching 90 billion dollars. Many of those lines are in older neighborhoods and in communities of color, where records are weakest. For background on how Flint first brought this risk into national view, see our account of the Flint water crisis history.
How a Predictive Model Guesses Pipe Material
A predictive model is a computer ranking system that estimates the chance of lead at each address. It does not see underground. It looks for patterns in available data and assigns each unknown service line a probability score, often described as ranging from unlikely lead to likely lead.
The U.S. Environmental Protection Agency describes common approaches as machine learning decision tree models and logistic regressions that use inputs such as housing age and community profile, according to the EPA overview of predictive modeling for lead service line identification. A decision tree model splits homes into groups based on features such as age and location. Logistic regression estimates probability from weighted factors. Newer systems also use ensemble methods such as random forest and XGBoost, which combine many small models.
Typical inputs include:
- Home age, size, value and location
- Historic tap cards, permits and utility repair records
- Pipe material found at nearby homes
- Results from prior inspections and water tests
- Geographic data mapped in a utility database
The process is iterative. Engineers train the model on addresses where pipe material is already confirmed. The model then scores unknown addresses, and crews check the highest-ranked addresses first through field inspection.

Those new results go back into the model, which then makes sharper predictions for the remaining unknowns.
Flint Showed What Prediction Changes
Flint, Michigan, became the first major test of lead service line prediction AI. After the 2014 water source change and the failure to apply proper corrosion control, lead leached from aging pipes into drinking water. The city faced a second problem that many cities still face. Records could not reliably say which homes had lead pipes.
Researchers Jacob Abernethy and Eric Schwartz, then at the University of Michigan and Georgia Tech, built a model with students to answer a practical question: where should crews dig next? The team digitized old city plans and more than 140,000 handwritten records, then cataloged 71 pieces of information for each property, including age, value, and location. The model learned from homes where pipe material had already been exposed and then ranked the remaining homes.
The peer-reviewed result, published as ActiveRemediation: The Search for Lead Pipes in Flint, Michigan, reported strong model prediction performance with an AUROC score near 0.92 and a true positive rate of 97 percent in its test setup. AUROC is a standard test score where 1.0 means perfect ranking and 0.5 means random guessing. A high score means the model ranked lead homes above non-lead homes well, but the score itself is not a count of confirmed lead pipes.
The street level difference was easier to see. When Flint used the model to choose dig sites, crews found hazardous pipe far more often than when they dug without it:
In 2017, workers dug at 8,833 homes guided by the model and replaced hazardous pipe at 6,228 of them, a 70 percent hit rate. In 2018, after the city switched to a contractor-led plan that did not use the model for planning, workers dug at 10,531 properties and found only about 1,567 lead or galvanized pipes, about a 15 percent hit rate. After Flint returned to the model in 2019, the hit rate on the prioritized list rose to 64 percent, while homes dug outside the prioritized list had only a 3 percent hit rate.
| Period and method | Homes checked | Lead or galvanized found | Hit rate meaning |
|---|---|---|---|
| 2017, model-guided ranking | 8,833 | 6,228 | 70 of every 100 digs found hazardous pipe |
| 2018, without model guidance | 10,531 | About 1,567 | 15 of every 100 digs found hazardous pipe |
| 2019, model prioritized list | Part of 3,863 checked that year | 1,413 replaced that year | 64 of every 100 prioritized digs found hazardous pipe |
| 2019, outside prioritized list | Included in checks above | Very few | 3 of every 100 non-prioritized digs found hazardous pipe |
An early targeted phase was even sharper. In September 2016, Flint selected 171 homes based on high lead test results or high risk residents. Excavation confirmed lead at 165 of those 171 homes, a 96 percent hit rate, while old city records had suggested only 40 percent would contain lead. The comparison shows why utilities now pair the model prediction for each street with a confirmed pipe result from digging before they report progress.
From Detroit to San Diego: Prediction at Scale
After Flint, the same approach spread to larger systems facing the same gap between paper records and buried pipe.
In Detroit, officials faced an estimated 80,000 lead service lines. The Detroit Water and Sewerage Department adopted predictive modeling developed from the Flint work to create its inventory. Local reporting at the time said the approach could cut the amount of excavation needed by more than 95 percent and save an estimated 165 million dollars. The reported model accuracy was about 85 to 90 percent, meaning most checked addresses proved correct after digging, while the rest still required correction.
In Pittsburgh, researchers merged water authority lateral records with property data and tested logistic models. The best model reached 78 percent accuracy in predicting lead laterals found through recent inspections, with nearby lead pipes, installation date and inspection history among the strongest signals. Using inspections plus predictions, the study estimated about 39,000 lead laterals in the service area. The study shows that even a useful model still misses some lead lines, so field checks remain essential.
In San Diego, contractor Kleinfelder reported assessing more than 300,000 service lines citywide and finishing the initial inventory 10 months ahead of schedule. The city found no lead in city-owned service lines surveyed from 2010 to 2020, then focused on customer-owned lines. The project field verified material at 15,000 high-risk customer accounts and built a public map, a report, a hotspot map, and a database that can keep collecting new results. The company says predictive modeling and machine learning helped prioritize that work and left the city with a long-term tool for planning replacements.
Smaller towns show a second use of prediction. The goal is not always to find the next lead pipe. It can be to show with statistical confidence that most unknowns are not lead, so limited staff can focus elsewhere.
- In Yarmouth, Massachusetts, engineers used a statistical approach backed by 377 randomized verification digs that found no lead or GRR. That sample supported a statement with 95 percent confidence that less than 0.66 percent of service lines in three districts were lead or GRR. In plain terms, if the same sampling were repeated many times, the true share would fall below that threshold in about 95 of 100 repeats.
- In Medway, Massachusetts, crews first processed a sample of handwritten tie cards and meter sheets to train a document intelligence platform, an AI tool that reads old forms. The system then reviewed the remaining 5,000 documents far faster than manual review, which freed staff for inventory analysis and field planning.
BlueConduit, the company founded from the Flint research, now reports work in 330 communities serving more than 18 million people, with 5.8 million service lines inventoried. The company reports that for early customers that completed inventory and replacement work, lead predictions matched confirmed ground truth in more than 90 percent of cases, and that customers spent 90 to 95 percent less on service line material identification than with physical verification alone. Those are company-reported figures, so they describe model prediction matched to later confirmation, not independent federal test results.
What EPA Rules Now Require
Federal rules explain why prediction work accelerated. The 2021 Lead and Copper Rule Revisions required every water system to develop an initial service line inventory, make it public and submit it to the state by October 16, 2024. Each line had to be listed as lead, galvanized requiring replacement, non-lead or unknown.
The Lead and Copper Rule Improvements build on that list. According to the EPA service line inventory and replacement fact sheet, systems must prepare a baseline inventory by November 1, 2027 that adds connector material and updates older entries. Systems with lead, GRR or unknown lines must notify affected households each year and prepare a replacement plan. Full replacement of lead and GRR lines under utility control is generally required within 10 years, which points to about 2037, with limited exceptions.
EPA researchers stress that predictive modeling is a complementary tool, not a substitute for verification. Their March 2025 guidance says models can help decide where intensive methods such as mechanical excavation are warranted and where simpler visual inspection may be enough, but data, thresholds and methods should be matched to local needs. In other words, a probability map can guide digging, but only digging, inspection or a validated record can change an unknown to lead or non-lead in the official inventory.
Why a Prediction Is Not Proof
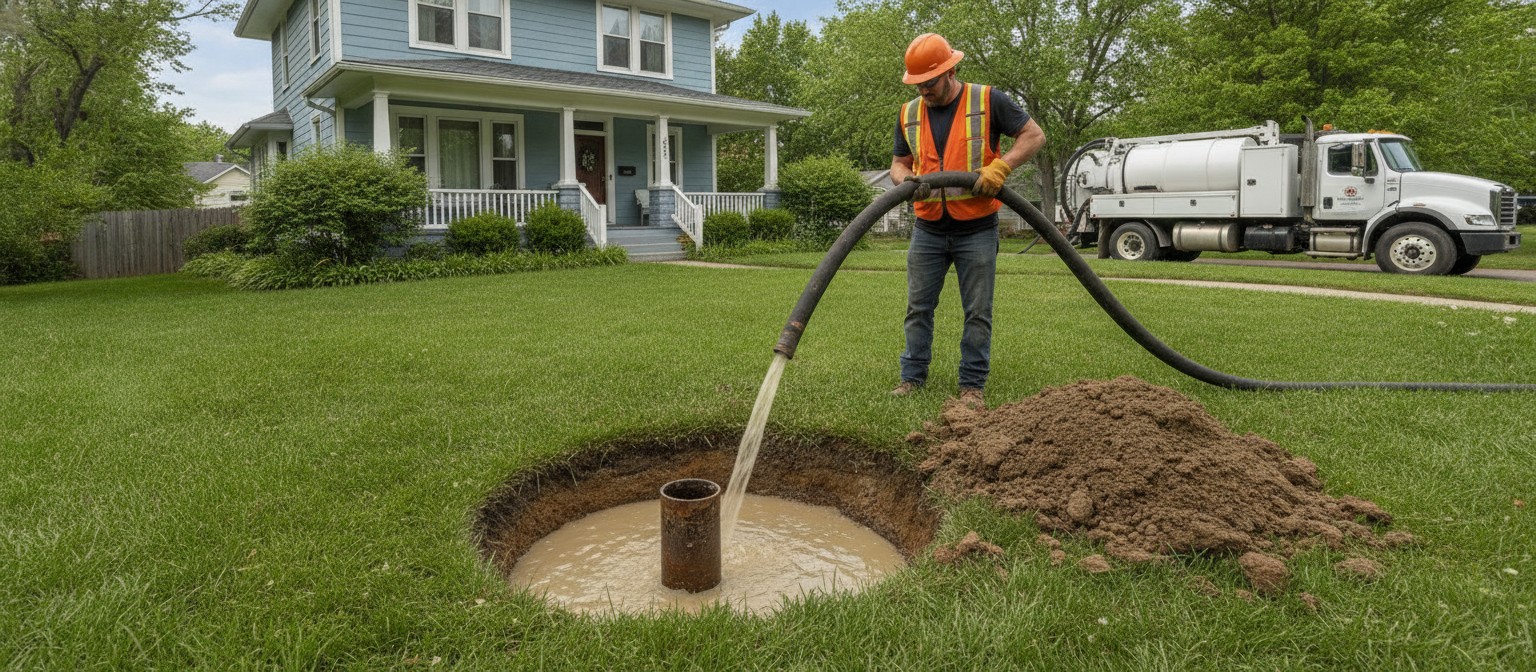
A verification dig is a small, targeted hole made to see and record the actual pipe material. Common methods include hand digging, vacuum excavation and hydrovac, which uses pressurized water to expose soil around the pipe with less disruption than a backhoe. Until that step happens, a high score means check here first, not lead confirmed. A low score means lower priority, not proven safe.
This distinction matters for households. Even low levels of lead exposure can harm health, and federal health agencies say no amount of lead in drinking water is considered safe. A model can shorten the time a family lives with an unknown pipe by moving their street higher on the dig list, but it cannot clear a home without physical evidence. Readers looking for immediate ways to reduce exposure while waiting for verification often turn to filtration, including the filter straw designed to remove lead covered previously on Intelligent Living.
Equity also affects accuracy. If a model learns mainly from neighborhoods with complete records, it can repeat gaps in neighborhoods with missing records. Researchers therefore recommend collecting random field samples that give unbiased estimates, consulting residents and updating the model as new digs come in. As described in the Rockefeller Foundation account of the Flint modeling work, each excavation cost about 3,000 dollars to check the pipe plus about 2,000 dollars more if replacement was needed, so avoiding empty digs saved both money and weeks of continued exposure.
Larger systems now apply the same ranked-dig-and-update cycle at higher volume, as described in a 2025 review of how cities use AI for drinking water safety, but the final inventory still rests on what crews saw in the ground.
Frequently Asked Questions
How accurate is lead service line prediction AI?
It depends on data quality and how accuracy is counted. Flint’s program saw model prioritized digs find lead several times more often than unprioritized ones, Pittsburgh reached 78 percent, and BlueConduit reports more than 90 percent agreement between predictions and later confirmed results for early customers. Each figure pairs a model prediction with a later confirmed pipe result from digging or inspection, and every model still misses some lead lines.
Does a low probability score mean my water is safe?
No. A low score means the model estimates lead is less likely at that address based on current data. It does not confirm the pipe material and it does not test the water. Only a validated record, visual inspection or excavation can move a line out of unknown status in the official inventory.
What data does the model use?
Most systems use home age, value and location, historic utility and city records, material found at nearby homes, past inspections and water test patterns. Newer projects add digitized tie cards, permits and maps through document intelligence tools. The model prediction improves as more confirmed dig results are added.
Do EPA rules allow predictive modeling?
Yes, as a supporting method. EPA guidance encourages predictive modeling to prioritize investigation and remediation, but it does not allow a probability score alone to classify an unknown line as non-lead. Classification still requires an evidence based record, inspection method or verification dig accepted by the state.
How long will replacement take?
Under the Lead and Copper Rule Improvements, systems must submit a baseline inventory and replacement plan by November 1, 2027 and then generally replace lead and galvanized requiring replacement lines within 10 years. Actual pace depends on funding, contractor capacity, field verification and how many unknowns remain.
What Comes Next
The buried network will not map itself. The practical advance is narrower and more useful. Cities can turn scattered paper records into a ranked work list, check the riskiest streets first and update the map with each confirmed pipe.
That loop does not remove uncertainty in one step. It spends fewer empty digs, finds more lead per week of work and leaves a cleaner inventory for the decade of replacement ahead. The best map remains a guess checked by digging, and each check makes the next guess better.

