
Global warming has shifted into a faster gear, and scientists now have the data to prove it. A landmark study published in Geophysical Research Letters in August 2026 has delivered the first statistically significant confirmation that the planet’s long-term warming rate is accelerating, not merely continuing at a steady pace. The findings, from researchers at the Potsdam Institute for Climate Impact Research (PIK), show that the rate of warming has nearly doubled since 2015, with major implications for the Paris Agreement’s 1.5°C threshold and the livability of regions worldwide.
This article breaks down what the latest science reveals about global warming acceleration, why it’s happening, which regions face the greatest risk, and what can be done to slow it down.
Scientists Sound the Alarm: Global Warming Is Accelerating
After decades of warming at a relatively steady pace, the planet’s temperature rise has entered a new phase. According to the study led by statistician Grant Foster and climate scientist Stefan Rahmstorf, the global warming rate has nearly doubled from approximately 0.2°C per decade (1970-2015) to roughly 0.35°C per decade over the past ten years.
The researchers arrived at this conclusion by analyzing five major global temperature datasets, including those from NASA and NOAA. They adjusted the data to remove short-term natural fluctuations caused by El Niño, volcanic eruptions, and solar cycles, isolating the underlying warming trend driven by human activity.
The results were striking. The acceleration became visible around 2013 to 2015 and was confirmed with greater than 98% statistical certainty across all five datasets. “We can now demonstrate a strong and statistically significant acceleration of global warming since around 2015,” said Grant Foster, co-author of the study published in Geophysical Research Letters.
Notably, the analysis included 2023 and 2024, the two hottest years on record, meaning the acceleration persists even after accounting for the warming effect of El Niño during those outlier years. The recent pace of warming is faster than any previous decade since instrumental temperature records began in 1880.

How Bad Is Global Warming Right Now in 2026?
The current state of global warming is more severe than many people realize. According to the Indicators of Global Climate Change (IGCC) report published in June 2026, human-induced warming reached 1.37°C above pre-industrial levels in 2025, increasing at a rate of around 0.27°C per decade over the 2016-2025 period.
Key indicators of the current warming situation include:
- 2024 was the warmest year on record and the first year with an average temperature clearly exceeding 1.5°C above the pre-industrial level
- 2025 was the third warmest year on record, at 1.47°C above pre-industrial levels
- 2026 is on track to be the second warmest year, with a best estimate of 1.47°C above pre-industrial levels and a 19% chance of surpassing 2024
- All 10 of the hottest years on record have occurred since 2015
- Sea surface temperatures reached a new seasonally adjusted record high in June 2026
- The first half of 2026 was the third warmest on record across all six major datasets
The Society of Actuaries’ quarterly global warming report confirms that the estimated warming trend for the most recent 30-year period is approximately 0.48°F per decade, with the northern hemisphere warming faster than the southern hemisphere and land areas warming faster than the ocean surface.
According to the United Nations weather agency, global temperatures are set to stay near record levels, underscoring the urgency of emissions reduction efforts worldwide.
What’s Driving the Acceleration?
Several interconnected factors are pushing global warming into a higher gear. Understanding these drivers is essential for grasping why the acceleration is happening now and what it means for the future.
Record-High Greenhouse Gas Emissions
The primary driver remains greenhouse gas emissions, which reached an all-time high of 54.6 ± 5.5 gigatonnes of CO2 equivalent per year over the last decade (2015-2024). Carbon dioxide emissions from fossil fuels continue to dominate, but methane and nitrous oxide levels also remain elevated.
The Aerosol Unmasking Effect
One of the most significant and underappreciated factors is the reduction of sulfur dioxide (SO2) emissions. Sulfur aerosols have a cooling effect on the climate by reflecting sunlight back into space. As countries have cleaned up air pollution, particularly from coal-burning power plants and shipping fuel, the cooling mask provided by these aerosols has weakened, unmasking part of the warming effect of greenhouse gases.
This “aerosol unmasking” effect has contributed to the observed acceleration, particularly since the implementation of stricter air quality regulations and the International Maritime Organization’s 2020 sulfur cap on shipping fuel.
Weakening Carbon Sinks
Natural carbon sinks, such as forests and oceans, have historically absorbed a significant portion of human-emitted CO2. However, recent research suggests these sinks may be becoming less efficient as temperatures rise, leaving more CO2 in the atmosphere and amplifying the warming trend.
El Niño and Natural Variability
While the acceleration study removed the effects of El Niño to isolate the long-term trend, the strong El Niño events of 2023-2024 contributed to the record-breaking temperatures observed during those years. However, the acceleration persists even after accounting for these natural fluctuations.
The Effects We’re Already Seeing
The acceleration of global warming is not just a statistical abstraction. It is manifesting in observable changes across the planet’s climate system.
- Extreme weather events: Heatwaves, droughts, and heavy precipitation events are becoming more frequent and intense as temperatures rise
- Sea level rise: Thermal expansion of seawater and melting ice sheets are causing sea levels to rise at an accelerating rate, threatening coastal communities worldwide
- Ice sheet loss: Both the Greenland and Antarctic ice sheets are losing mass at increasing rates, contributing to sea level rise and disrupting ocean circulation patterns
- Ocean heat content: The world’s oceans are accumulating heat at an accelerating rate, with ocean heat content growth rates consistent with satellite measurements of Earth’s energy imbalance
- Ecosystem disruption: Shifting temperature zones are forcing species to migrate, altering ecosystems, and increasing the risk of biodiversity loss
The acceleration means these impacts are arriving sooner and with greater intensity than previous projections suggested, creating urgent challenges for adaptation and resilience planning. In the Arctic, improved understanding of how colliding ice floes alter sea-ice movement can help scientists model how the shrinking pack drifts, spreads, and reaches warmer water.
There is a counterintuitive twist in the same region. The Arctic melt season stopped lengthening around 2010 and has since plateaued at roughly 40 days longer than in 1979, a pause driven by thinner, more weather-sensitive ice rather than by any recovery.

Which Regions Face the Greatest Risk?
While global warming affects the entire planet, its impacts are not distributed evenly. Some regions face significantly higher risks due to geography, population density, economic vulnerability, and exposure to specific climate hazards.
Countries at Risk of Becoming Too Hot
Research suggests that by 2050, several regions could experience temperatures that push the limits of human habitability during extreme heat events. The Persian Gulf, South Asia, and parts of sub-Saharan Africa face the highest risk of dangerous wet-bulb temperatures that can be lethal even for healthy people outdoors.
US States Facing the Greatest Impact
Within the United States, states in the Southwest, Southeast, and Gulf Coast face the most severe consequences. Arizona, Florida, Texas, and Louisiana are particularly vulnerable due to a combination of extreme heat, sea level rise, hurricane intensification, and water scarcity.
Hemispheric and Land-Sea Differences
The data shows clear patterns in how warming is distributed:
- The northern hemisphere is warming faster than the southern hemisphere
- Land areas are warming faster than ocean surfaces
- Arctic regions are warming at more than twice the global average rate
- Polar regions and high-altitude areas experience amplified warming effects

Regional warming varies significantly: Arctic regions warm 2-3x faster than average, while Persian Gulf and South Asia face extreme heat risks (Credit: Intelligent Living)
These patterns mean that even regions once considered stable are experiencing dramatic changes, with cascading effects on weather patterns, agriculture, and water resources worldwide.
How Much Longer Will Earth Be Livable?
This is one of the most pressing questions in climate science, and the latest data provides a sobering answer. The remaining carbon budget, the total amount of CO2 that can still be emitted while keeping warming below 1.5°C, is estimated at approximately 130 gigatonnes of CO2 from the start of 2026.
At current emission levels, this budget will be exhausted in approximately three years, pushing the planet past the 1.5°C threshold around 2030.
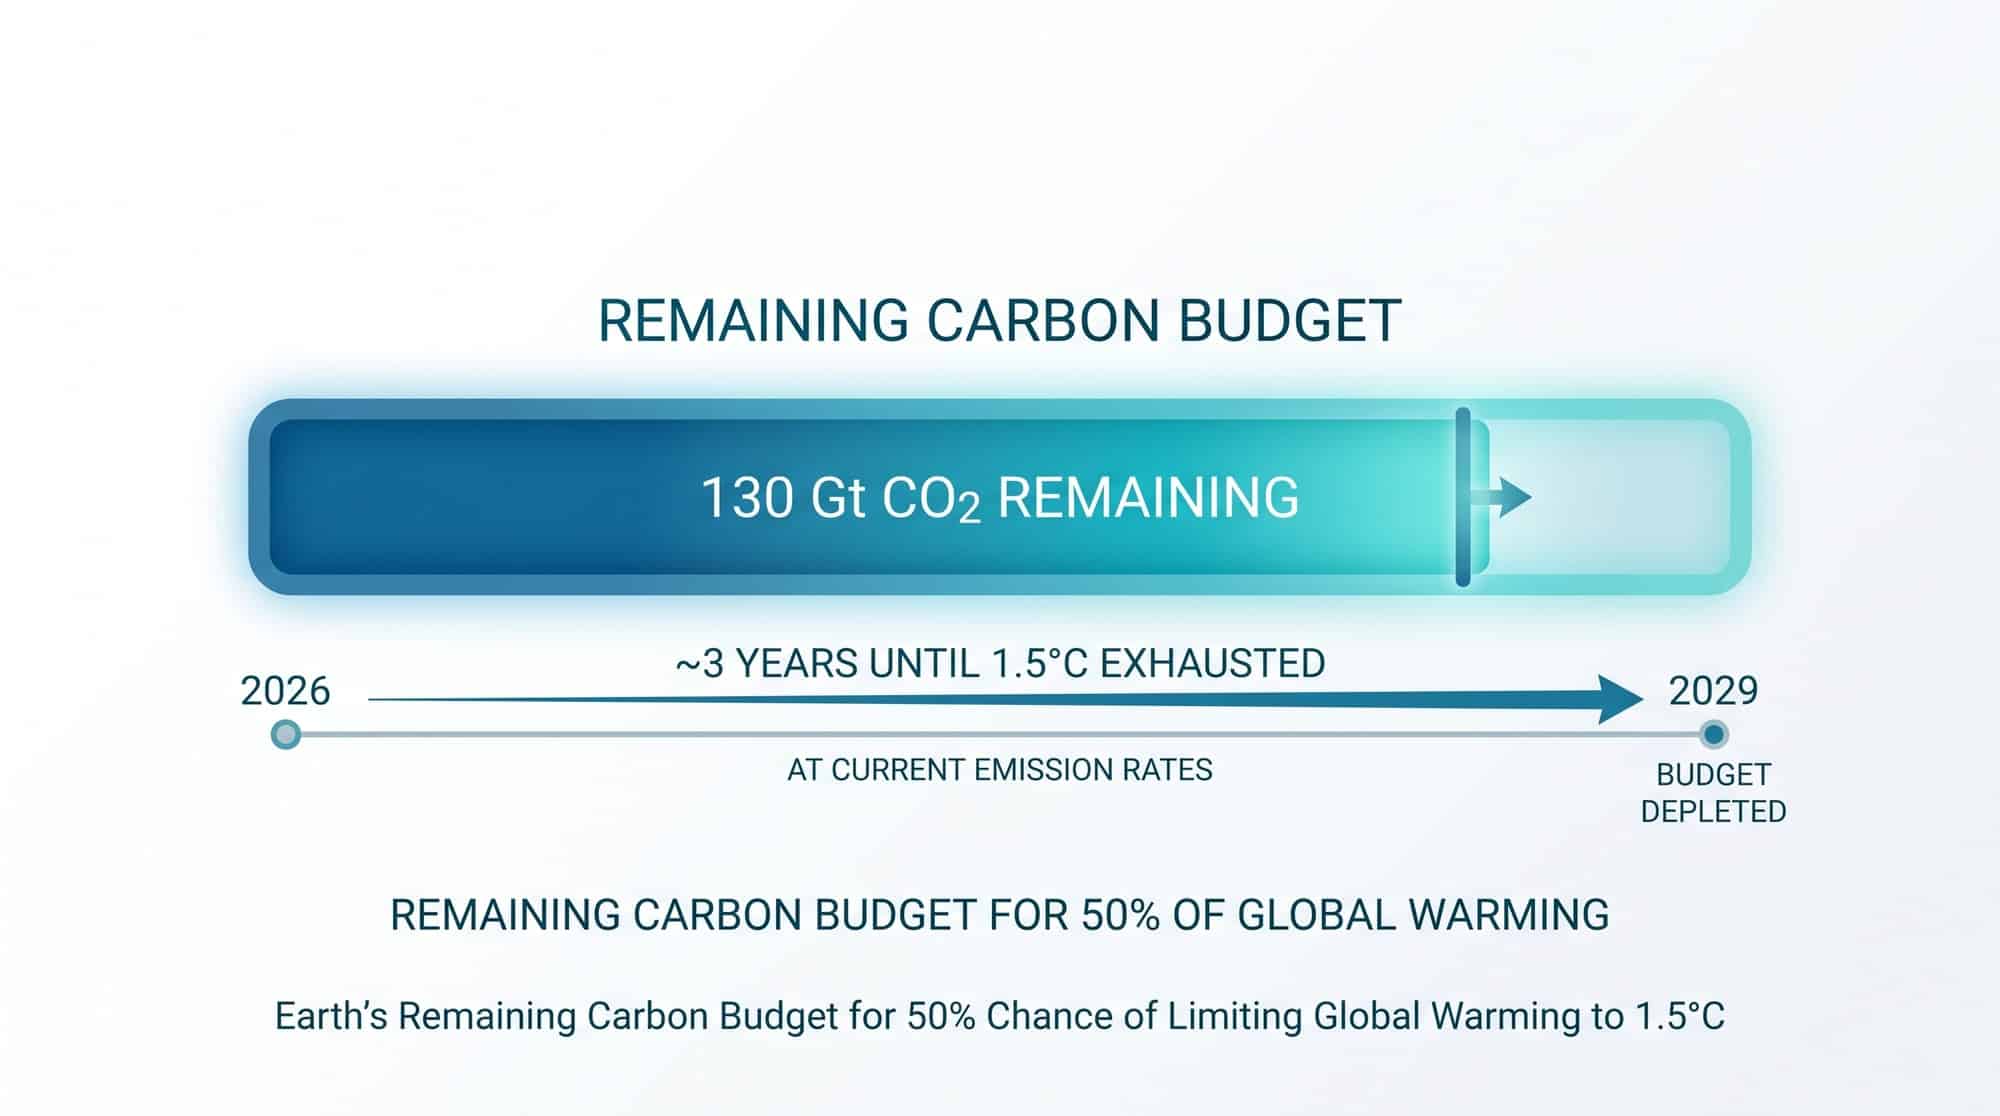
This timeline is consistent with the acceleration study’s finding that the warming rate has nearly doubled.
The 1.5°C Threshold
The Paris Agreement’s goal of limiting warming to 1.5°C above pre-industrial levels is now on the verge of being breached on a sustained basis. While individual years have already exceeded this threshold, the multi-year average is expected to cross it permanently within the next few years.
The 2°C Threshold
If current emission trends continue, the planet is on track to reach 2°C of warming above pre-industrial levels by mid-century. This level of warming would bring significantly more severe impacts, including widespread ecosystem collapse, major food production disruptions, and displacement of hundreds of millions of people.
Tipping Points
Scientists are particularly concerned about climate tipping points, thresholds beyond which changes become self-reinforcing and irreversible. These include the collapse of the West Antarctic ice sheet, the die-off of the Amazon rainforest, and the disruption of the Atlantic Meridional Overturning Circulation. The acceleration of warming increases the risk of triggering these tipping points sooner than expected.
Understanding the difference between 1.5°C, 2°C, and higher levels of warming is crucial for grasping what’s at stake as the planet approaches these thresholds.
What Can Be Done to Slow Global Warming?
While the acceleration of global warming is alarming, it is not yet irreversible. Aggressive action on multiple fronts can still slow the rate of warming and limit the worst impacts.
Rapid Emissions Reduction
The most critical step is a rapid and dramatic reduction in greenhouse gas emissions. This requires a transition away from fossil fuels toward renewable energy sources, electrification of transportation, and improvements in energy efficiency across all sectors.
Carbon Removal Technologies
In addition to reducing emissions, developing and scaling carbon removal technologies will be necessary to address the CO2 already in the atmosphere. This includes both nature-based solutions like reforestation and technological approaches like direct air capture.
Aerosol Management
The unmasking effect of reduced SO2 emissions presents a policy dilemma. While air pollution is harmful to human health, the cooling effect of aerosols has been masking some of the warming. Policymakers must navigate this trade-off carefully, pursuing clean air while accelerating emissions reductions to compensate for the lost cooling effect.
Adaptation and Resilience
Even with aggressive mitigation, some level of additional warming is already locked in. Building resilience through improved infrastructure, early warning systems, and adaptive agricultural practices is essential for managing the impacts that can no longer be avoided.
The transition to clean energy technologies is already reshaping the global landscape, offering both environmental and economic benefits as the world moves away from fossil fuels.
International Cooperation
Climate change is a global problem that requires coordinated global action. Strengthening international agreements, increasing climate finance for developing nations, and accelerating technology transfer are all critical components of an effective response.
For a deeper look at how temperatures are tracking against the Paris Agreement goals, see our earlier analysis of the latest climate projections.
Frequently Asked Questions
Is global warming a natural cycle?
While Earth’s climate has natural cycles driven by orbital variations and other factors, the current warming trend is overwhelmingly driven by human activities. The rate and magnitude of warming observed since the mid-20th century are unprecedented in the context of natural variability, and the scientific consensus, supported by multiple independent lines of evidence, attributes the majority of observed warming to greenhouse gas emissions from burning fossil fuels, deforestation, and industrial processes.
Was the Earth hotter 2000 years ago?
No. Global temperatures 2000 years ago, during the Roman Warm Period, were cooler than today. Proxy records from ice cores, tree rings, and ocean sediments show that current global temperatures are higher than at any point in at least the past 2000 years, and likely much longer. The Medieval Warm Period (roughly 900-1300 CE) was also cooler than present-day temperatures on a global average basis.
Is global warming slowing down?
No. The latest research confirms the opposite: global warming is accelerating. While there was a temporary slowdown in surface warming during the early 2000s, often called the “global warming hiatus,” this was due to natural variability and ocean heat uptake. Since 2015, the warming rate has nearly doubled, and the long-term trend shows clear acceleration with greater than 98% statistical certainty.
How much has global temperature risen?
Global average temperature has risen approximately 1.37°C above pre-industrial levels (1850-1900 baseline) as of 2025. The warming rate over the past decade has been approximately 0.35°C per decade, nearly double the rate observed from 1970 to 2015. At the current pace, the planet will exceed 1.5°C of warming above pre-industrial levels before 2030.
What is the main cause of global warming?
The main cause of global warming is the emission of greenhouse gases from human activities, primarily carbon dioxide (CO2) from burning fossil fuels (coal, oil, and natural gas). Other significant contributors include methane from agriculture and fossil fuel extraction, nitrous oxide from fertilizers, and deforestation, which reduces the planet’s capacity to absorb CO2. Together, these activities have increased atmospheric CO2 concentrations from approximately 280 parts per million before industrialization to over 420 ppm today.

