
Hazy commutes and stubborn asthma flares often turn abstract air pollution rules into a personal crisis overnight. WHO’s updated air-quality standards database changes the conversation by putting national legal limits in one comparable place, making it easier to tell whether a country’s rules look like a real health safeguard or a thin line drawn on paper.
Analysing this global scoreboard reveals a critical ‘protection gap’—the margin between permissive legal limits and verified health safety thresholds. For families living near traffic corridors or industrial zones, these numbers aren’t just data points; they represent the threshold between healthy development and chronic respiratory strain. By standardising national limits for PM2.5 and nitrogen dioxide, the tool allows anyone to fact-check local safety claims without needing a background in environmental law.
True protection begins when residents realise that ‘legal’ doesn’t always mean ‘low risk’. The 2025 update provides the evidence needed to demand tighter regulations, ensuring that economic trade-offs don’t come at the cost of public lung health.
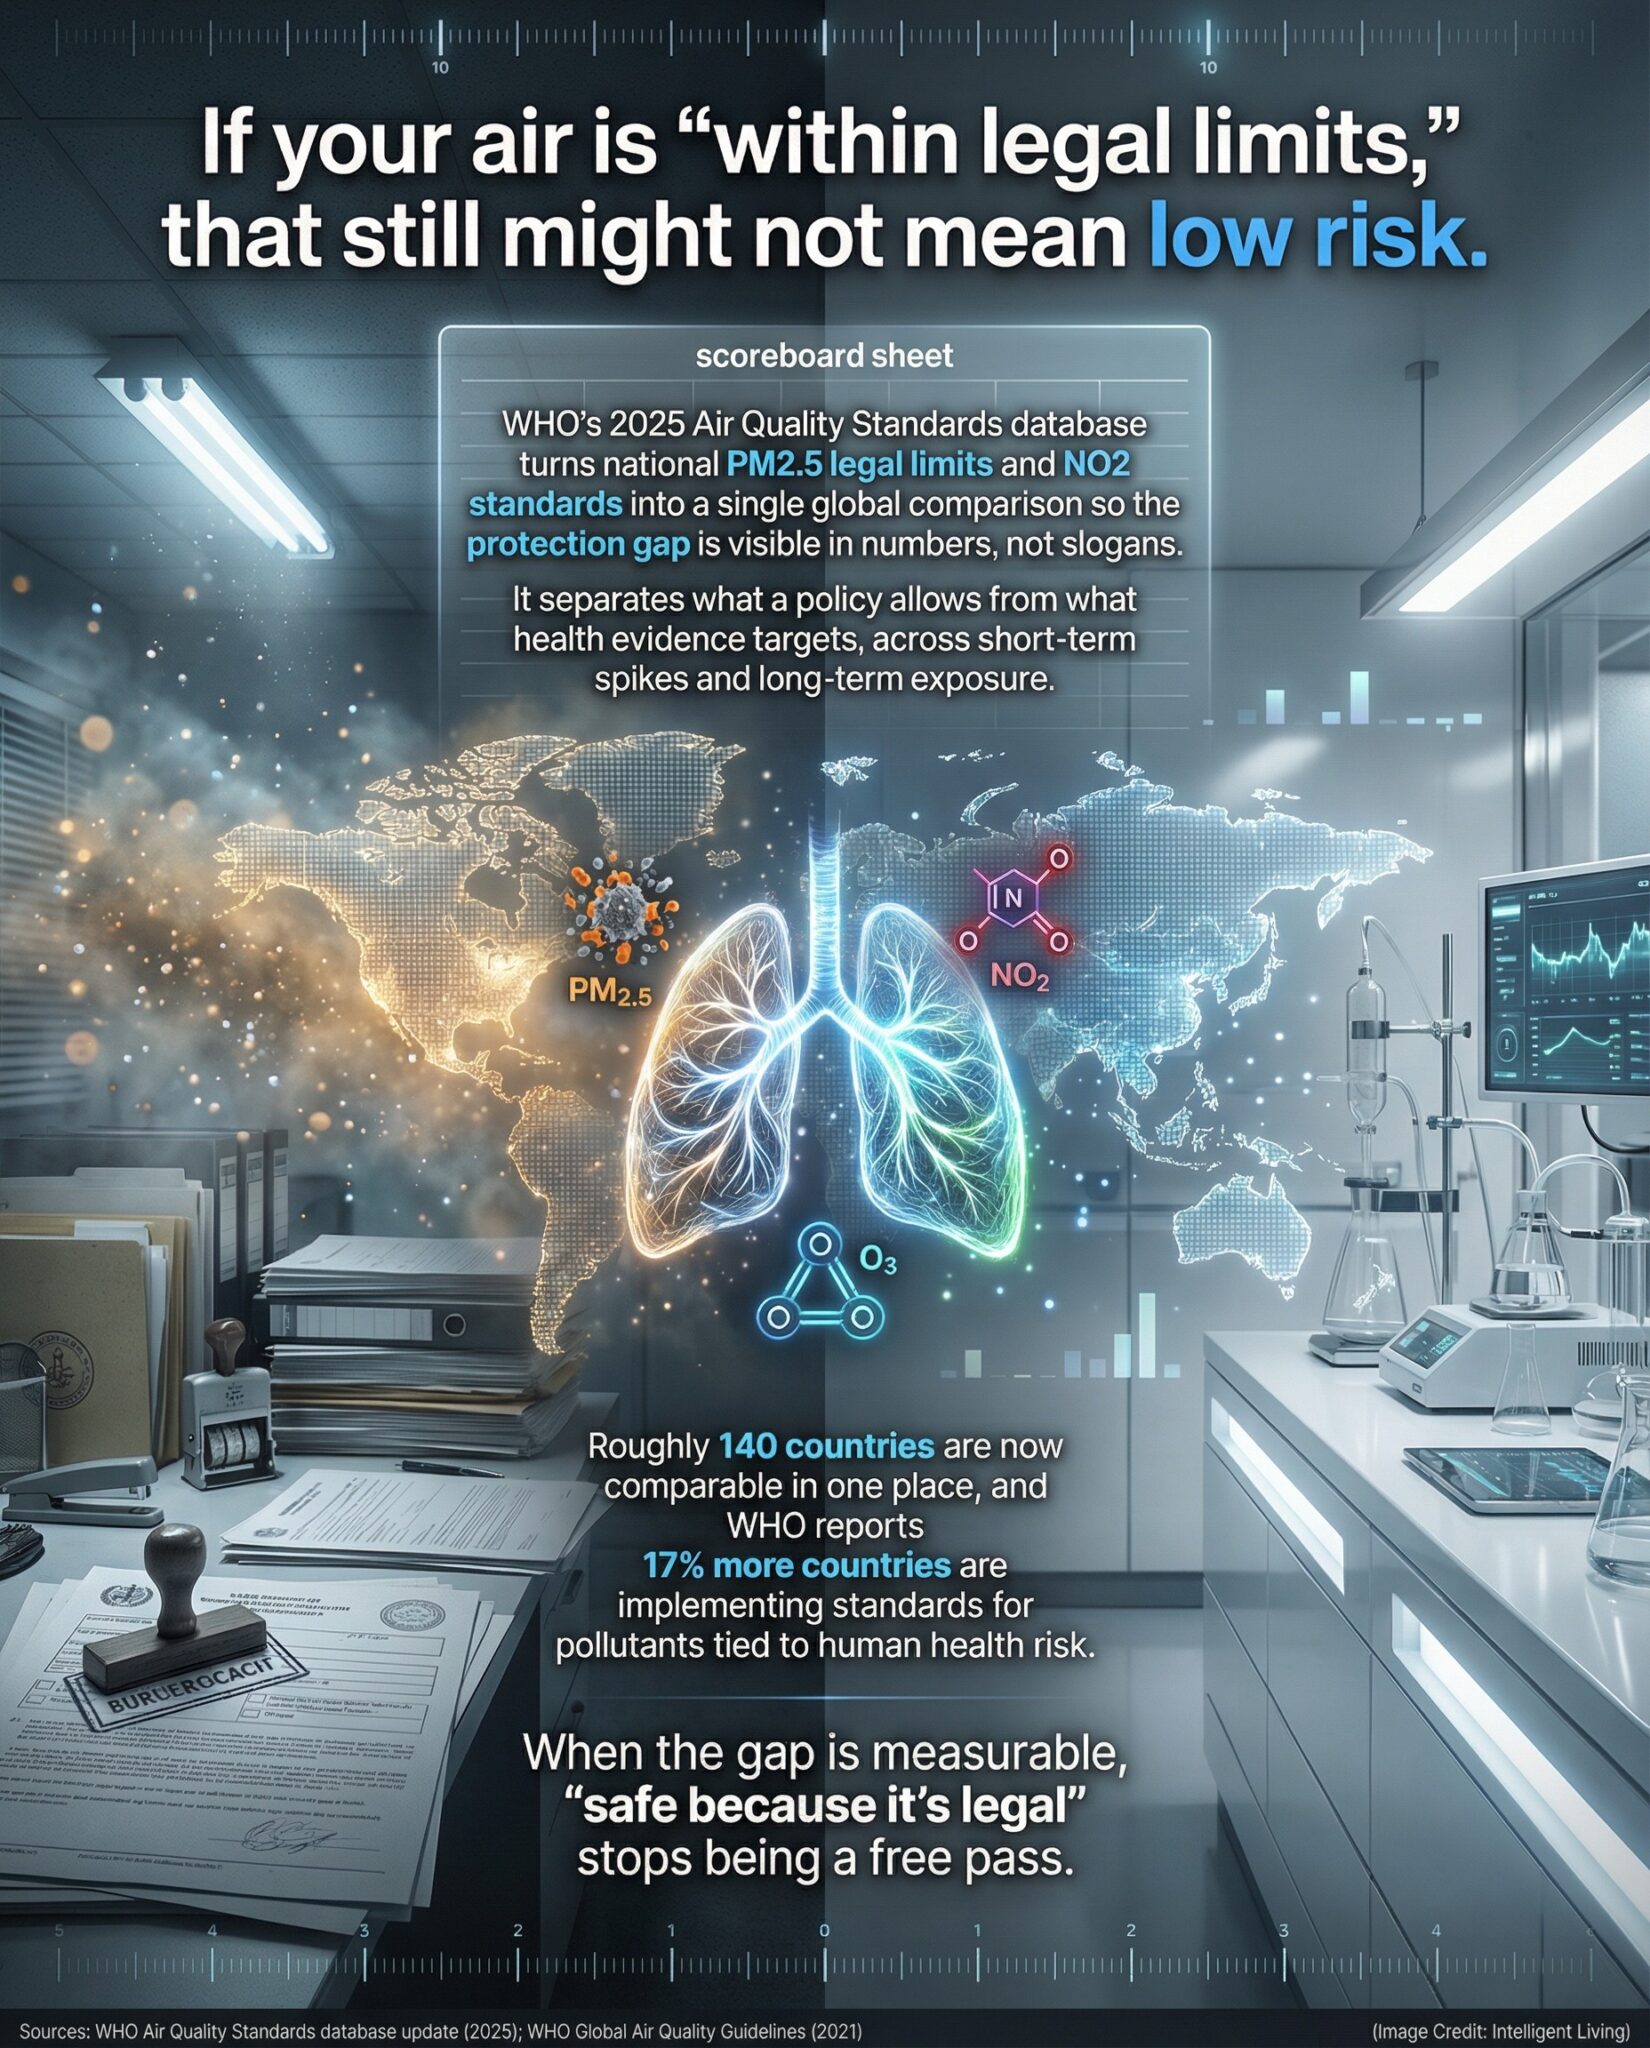
Global Air-Quality Data Alignment: Why 2025 is a Turning Point for Standards
Core Insights: WHO 2025 Standards Database Overview
This database functions as a practical planning instrument for global health instead of a mere morality chart. It is a structured way to compare air quality standards by country and understand how far national legal limits sit from health-based targets.
Standardised measurement protocols enable direct comparisons of legal ceilings across different regions, eliminating the guesswork from international air-quality tracking.
- The database compiles national air quality standards for major criteria air pollutants with wide-ranging health impacts and frequent regulatory oversight.
- It covers substances tracked within national ambient air quality standards systems, including ozone and carbon monoxide, which impact public health across diverse regions.
- It organises limits by averaging time, such as annual averages and 24-hour limits, which is what makes cross-country comparisons coherent.
- WHO’s February 2025 database update reports coverage of about 140 countries across all regions and notes that more countries have adopted standards for pollutants tied to health risk.
- A legal limit is a compliance trigger written into policy, while a guideline level is a health target based on evidence.
- Mapping the gap between legal ceilings and health benchmarks exposes how frequently policy targets diverge from medical safety standards.
Once that gap is visible, the database becomes a fast way to ask smarter questions about air pollution regulation, monitoring, and enforcement without needing a law degree.
Transforming Fragmented National Data into Universal Health Benchmarks
WHO turned scattered national standards into a single dataset that can be compared across pollutants and time windows. That shift matters because “our rules are strict” is hard to evaluate when every country publishes limits in a different format and sometimes with different averaging times.
The database operates as a core component of the WHO’s air quality planning and evaluation tools, helping to align policy with medical evidence.
The primary impact involves shifting the debate from political opinions to the precise PM2.5 and NO2 concentrations permitted by law. This data serves as the most accurate public-facing safety label currently available for national air quality.
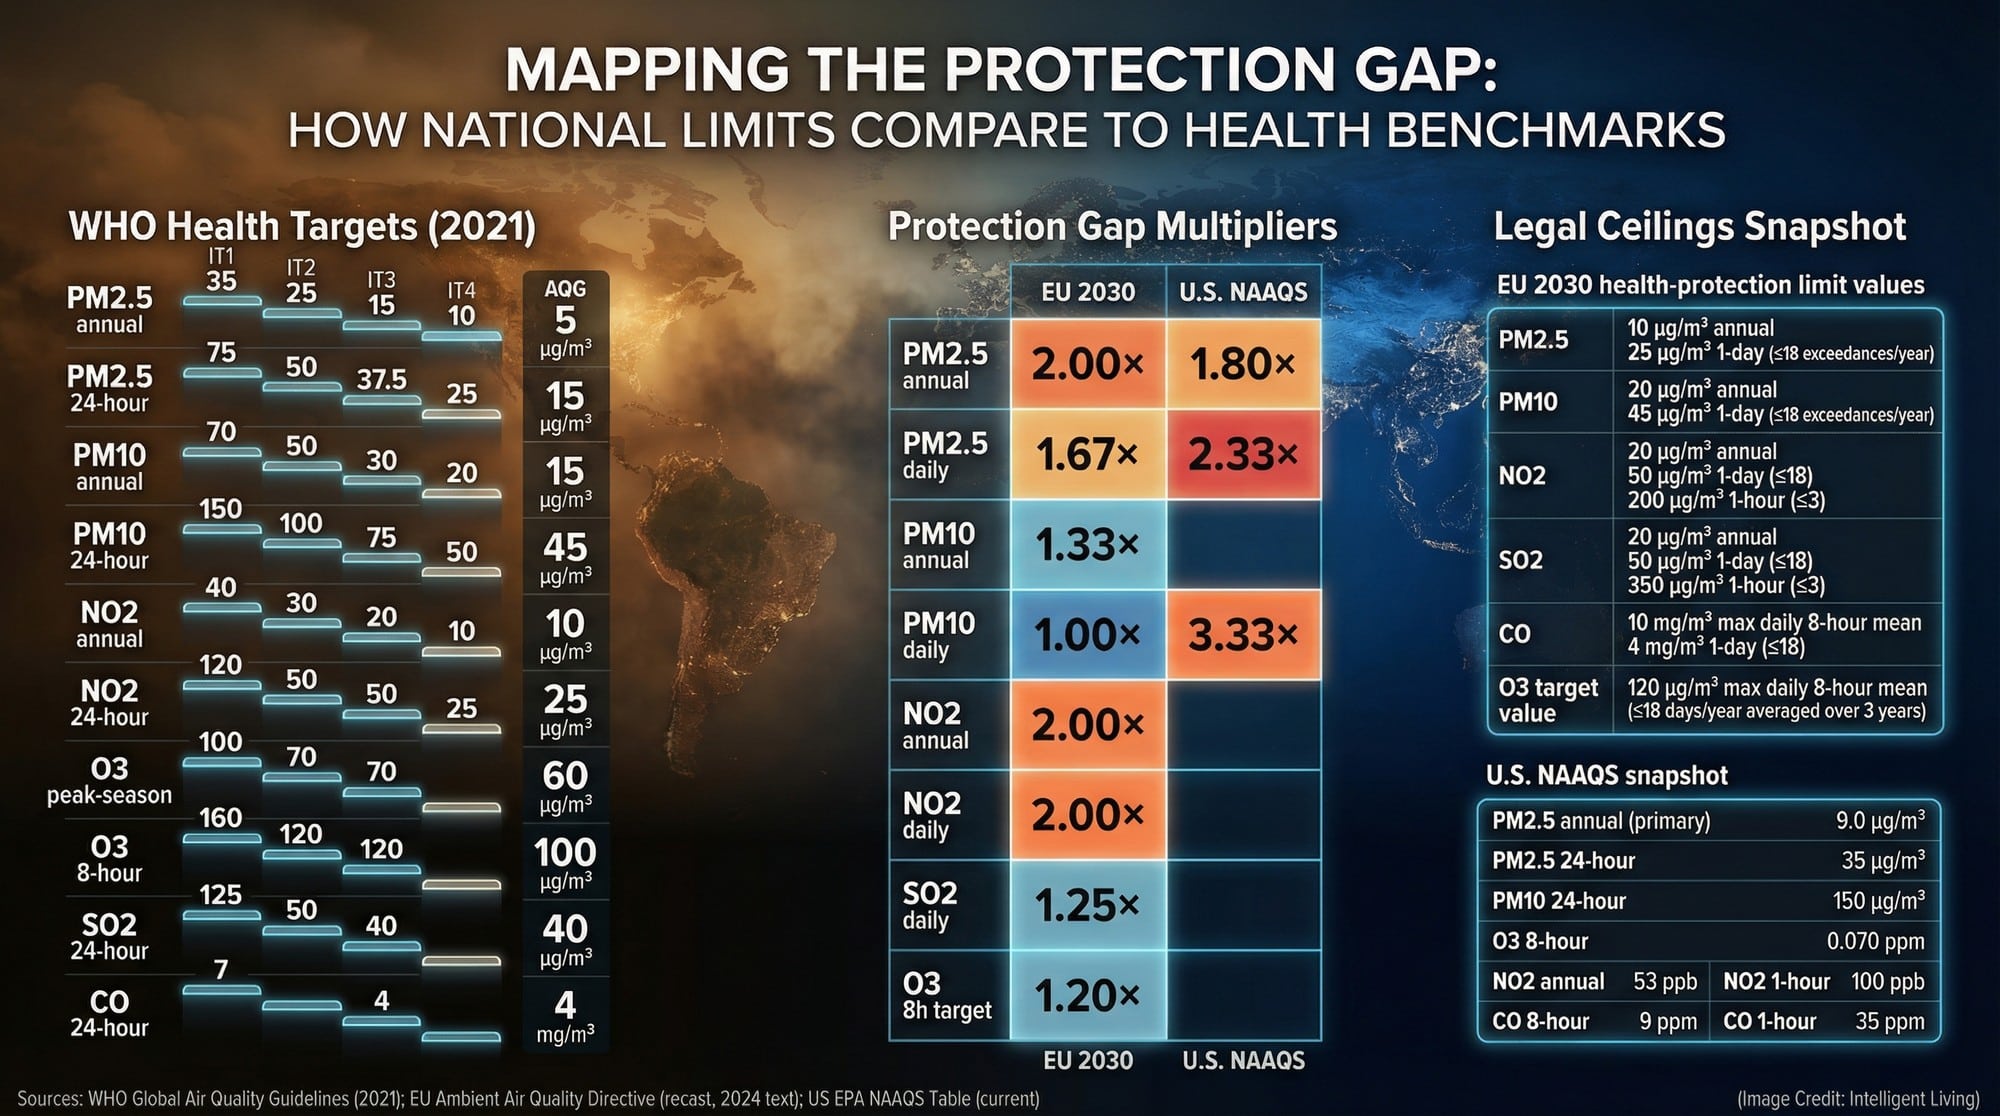
Mapping The Protection Gap: How National Limits Compare to Health Benchmarks
Benchmarking Compliance: Measuring Legal Ceilings Against Medical Advice
The database lines up legal limit values across countries so the difference between “allowed” and “healthy” becomes visible. A legal limit is the maximum concentration regulators accept before action is required, while a health benchmark is the level linked to substantially lower risk.
Maintaining clear guideline levels and interim targets allows health officials to separate strictly enforced limits from idealised safety benchmarks.
Visualise a school pickup line during a high-AQI afternoon where the air smells sharp and children are coughing. Beyond asking how bad the air is today, residents must know what the law deems acceptable. This database provides those exact figures.
Transforming Legal Provisions into Quantifiable Health Metrics
Instead of sending readers into national law libraries, the tool surfaces numeric ceilings and organises them in a way that can be mapped, charted, and compared. It is not a live sensor, but it does show whether policy targets look aligned with modern health science.
Discrepancies between cities with identical air quality often stem from outdated legislation or historical political compromises rather than modern health science.
Support Advocacy, Research, and Journalism
A standardised list of official limits gives researchers and reporters a stable baseline for cross-country analysis. It also gives civic groups a concrete reference point when asking why one country’s PM2.5 limits sit far above another’s.
Anchoring local debates in specific annual limit values provides a concrete foundation for advocacy, moving beyond vague promises of ‘clean air’ to measurable policy goals.
Technical Mechanics: Pollutant Selection and Averaging Window Protocols
Which Pollutants are Included and Why
Six specific pollutants remain the primary focus due to their consistent correlation with clinical harm in global epidemiological studies. Small concentrations of PM2.5 fine-particle pollution can penetrate deep into the respiratory system and enter the bloodstream.
While nitrogen dioxide typically tracks traffic exposure, ozone serves as a potent oxidant known to trigger severe respiratory irritation. Each pollutant reveals a unique exposure narrative, collectively covering the most frequent toxic pathways encountered in modern life.
Averaging Times: Annual, 24-Hour, and 8-Hour Limits
Calculations of air pollution compliance rely on specific averaging windows. While annual averages track the chronic disease risks associated with long-term exposure, shorter limits address acute spikes.
Commuters trapped behind diesel buses instinctively understand why short-term spikes matter. Official 2021 WHO air quality guideline levels for PM2.5 and ozone make the differences between health targets and immediate legal ceilings concrete.
The Interactive Map and Microdata Access
WHO publishes the standards as an interactive air-quality standards map that allows fast comparison of short- and long-term limits without wading through legal archives. This structure is also what makes the dataset useful for charts, analysis, and long-term tracking.
For deeper work, the same framework supports microdata access so analysts can use the standardised entries for research-grade comparisons.
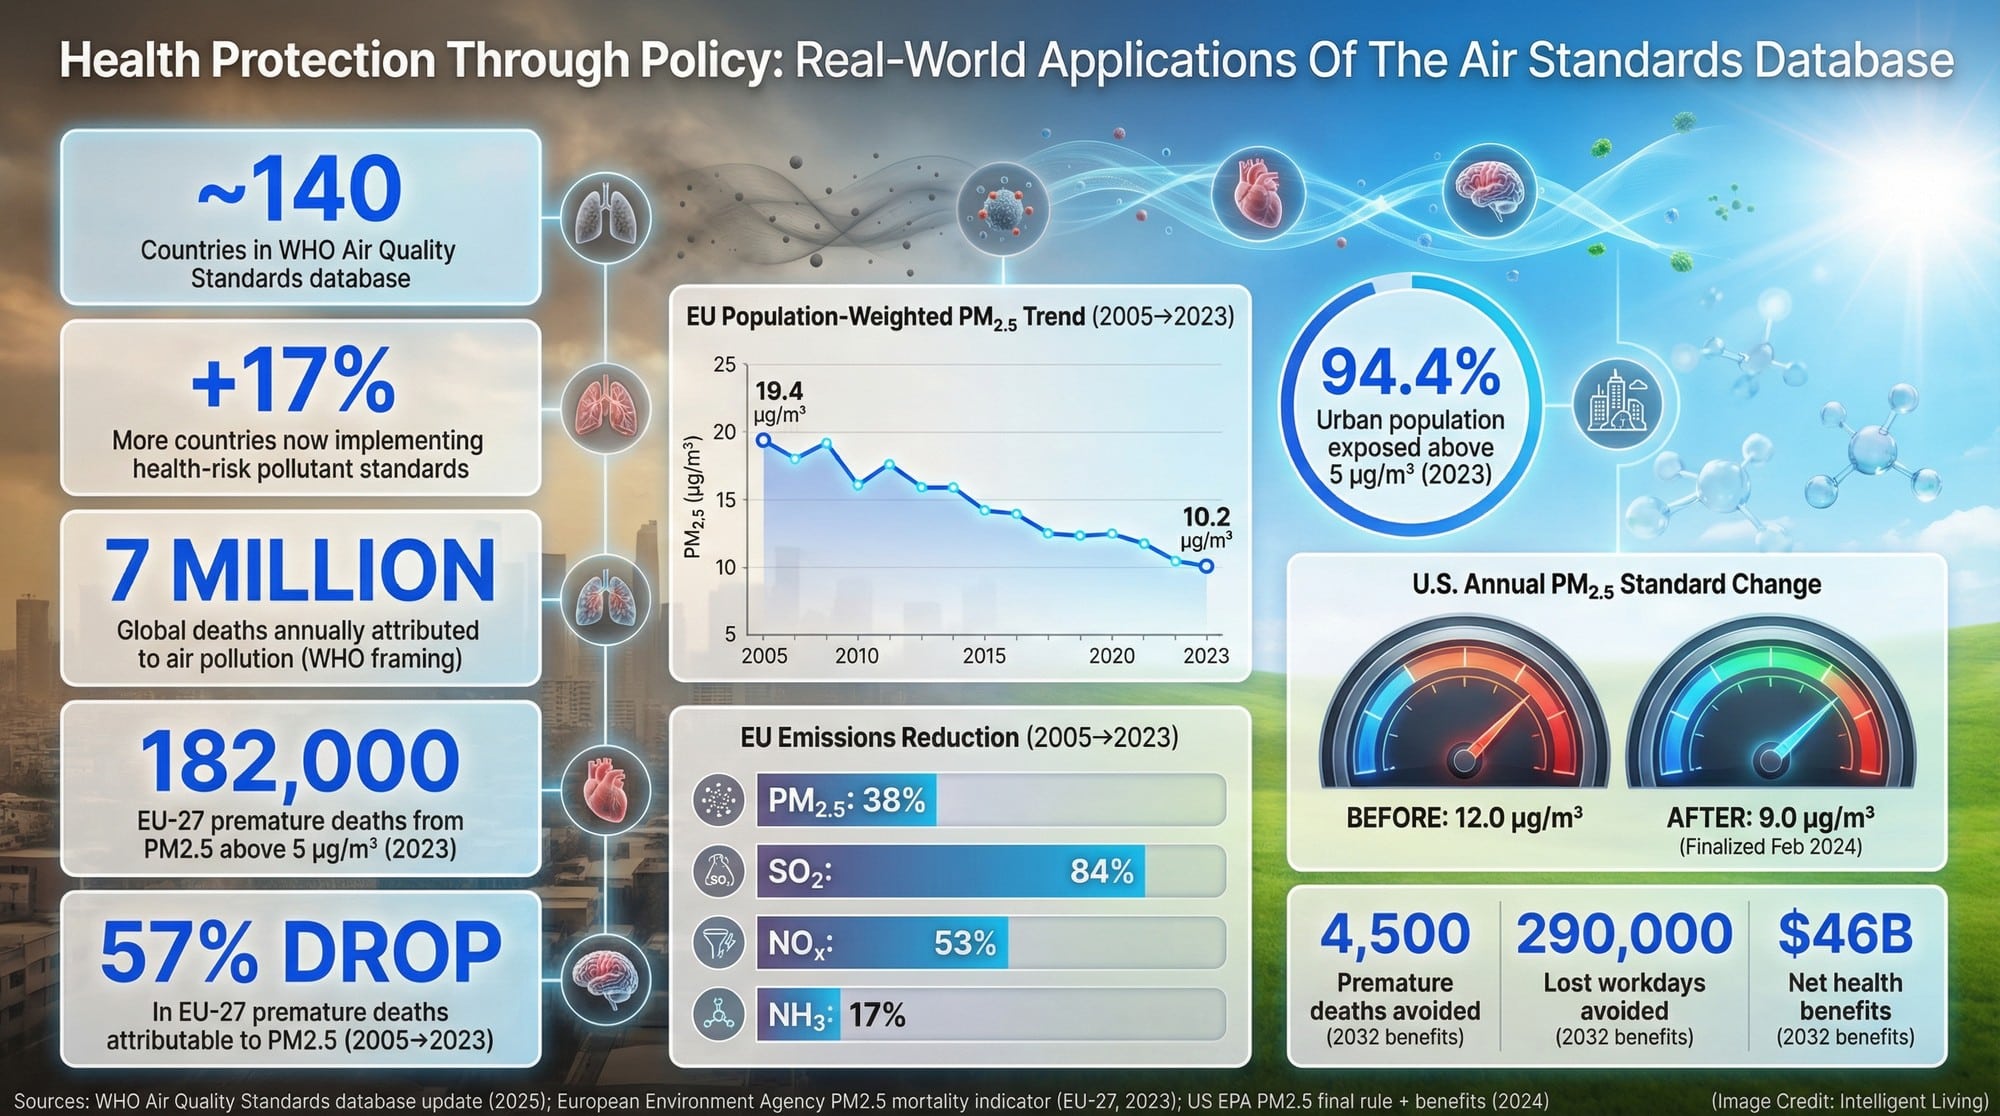
Health Protection Through Policy: Real-World Applications of the Air Standards Database
Science to Statute: Converting Health Evidence into Enforceable Limits
WHO’s Global Air Quality Guidelines are the science-based reference values used to estimate where health risk drops substantially. The epidemiological evidence supporting WHO guidelines illustrates why reducing pollutant concentrations significantly lowers the global disease burden.
Global health guidance only translates into tangible population protection when scientific benchmarks become enforceable legal limits and active emission reduction policies.
The Human Cost of Delay
WHO’s air pollution data portal tracks exposure and health impacts across countries, including the estimate of 6.7 million deaths worldwide in 2019 from ambient and household air pollution.
Reporting on SDG 3.9.1 translates abstract mortality figures into the reality of heart disease, lung conditions, and overwhelmed emergency rooms. Localised impacts often manifest as packed urgent-care waiting rooms during stagnant air weeks. Clinical data connecting air pollution to increased elderly hospitalisations underscores why carers prioritise evidence-based safety standards.
Current Implementation: Policy Benchmarking and Civic Advocacy in Action
Global organisations and local advocates utilise this dataset to drive real-world policy shifts across various sectors. By examining how different regions apply these figures, we can see a clear path toward better respiratory protection.
- Policy Benchmarking: Governments utilise cross-border comparisons to harmonise national limits with scientific guidance and peer performance.
- Cross-Country Health Research: Analysts use official limit values to test how regulation correlates with measured exposure, referencing the State of Global Air 2024 exposure estimates.
- Civic Accountability: Success stories, including domestic fuel sales restrictions in England, demonstrate how public health pressure can catalyse legislative change.
- Regulatory Drafting: Ministries spot common patterns to draft updates that fit local monitoring capacity while tracking health goals.
- Journalistic Checks: Recent initiatives, such as Thai police air pollution enforcement, highlight the transition from paper-based standards to real-world accountability.
Standardised data ensures that advocacy efforts are anchored in fact rather than vague promises, much as the EU air quality legal framework demonstrates by turning benchmarking into binding compliance schedules.
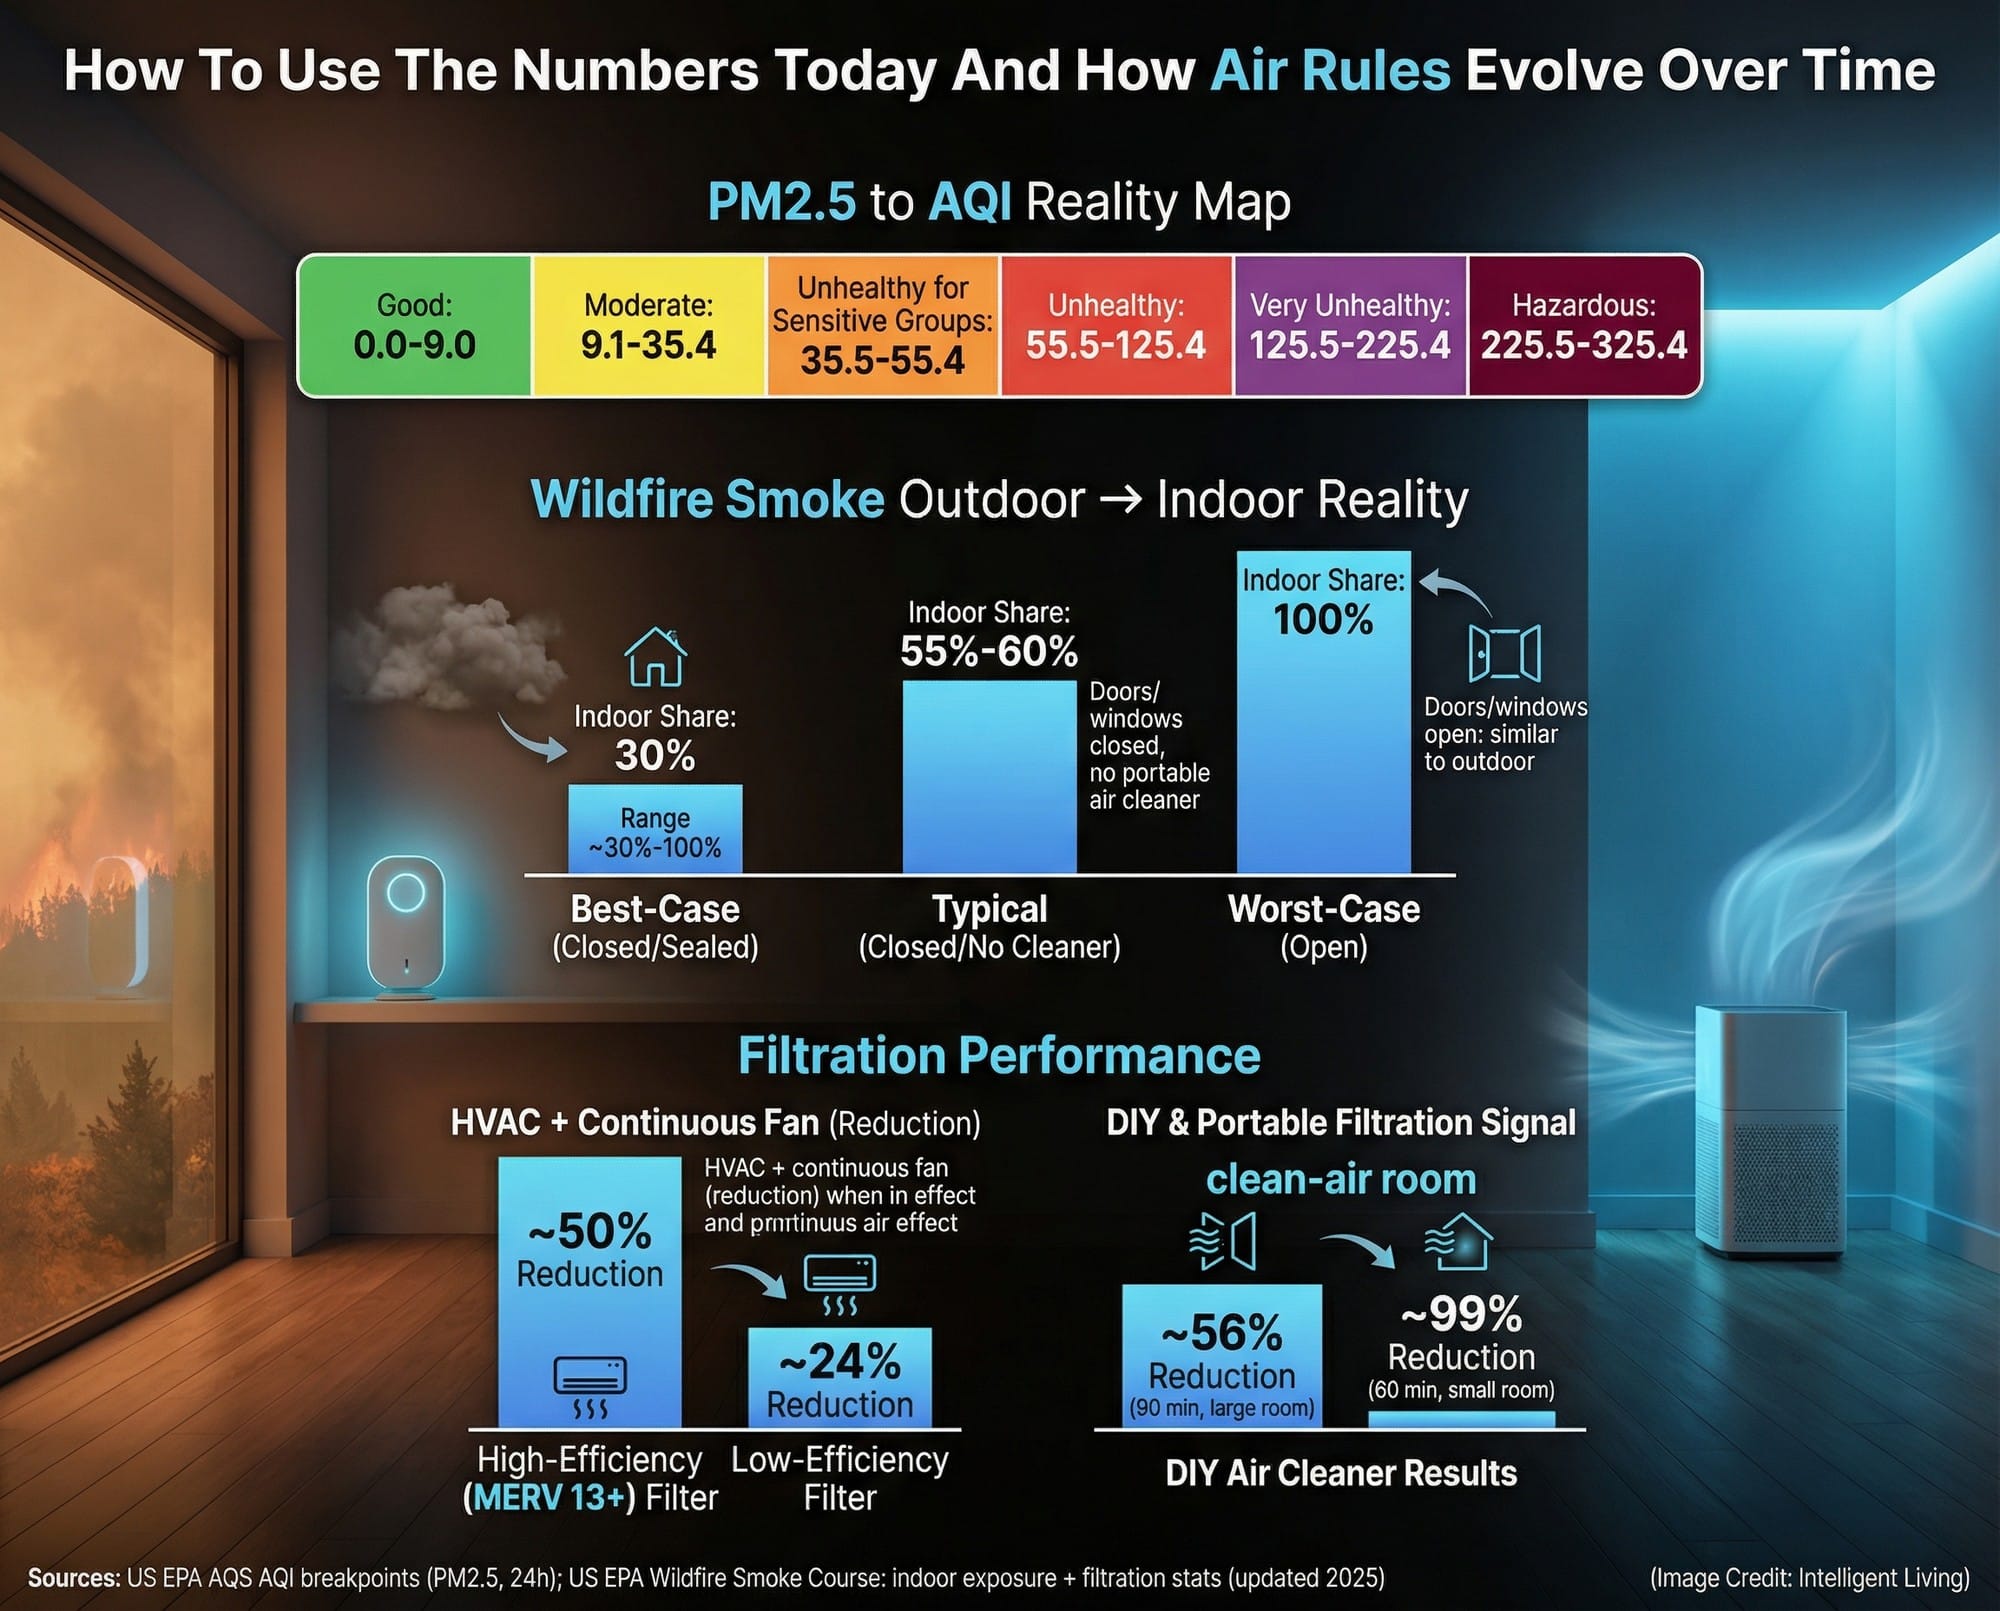
How to Use the Numbers Today and How Air Rules Evolve Over Time
Immediate Strategies: Checking National Limits and Reducing Exposure
Begin by identifying your country’s specific limit values within the database to determine if the legal ceiling reflects a genuine health target. This comparison clarifies why two hazy regions can feel different; national policy directly influences monitoring intensity, enforcement urgency, and the speed of emissions control deployment.
Treat indoor air as your fastest controllable layer of protection when outdoor quality turns hazardous. Implementing CADR-rated air purification for wildfire smoke helps families select effective filtration for high-pollution events.
Even small shifts, like prioritising the bedroom as a clean-air zone, can matter because that is where exposure time quietly accumulates.
Turn Numbers into Automation
Smart purifiers and PM2.5 sensors automate protection, removing the need for constant manual checks. Integrating smart bedroom air quality automation ensures continuous protection during sleep, when exposure risk is often overlooked.
A typical pattern is simple: the purifier ramps up when PM2.5 rises, then drops back when levels stabilise, which saves energy while keeping air cleaner during the hours people breathe the most.
Improve Central Filtration if You Have It
Upgrading central heating and cooling filters prevents outdoor particulate matter from lingering indoors. Proper HVAC filtration sizing and maintenance limits the circulation of outdoor particles throughout the home.
This is one of the few upgrades that works in the background every day, including during mild pollution periods that still add up over months.
Follow Official Advice for Smoke Events
During smoke episodes, public health agencies focus on sealing, filtration, and limiting indoor particle generation. EPA recommends indoor exposure reduction steps for wildfire smoke like sealing a clean room, running filtration continuously, and avoiding indoor particle sources during peak smoke.
Reducing the particles you breathe right now offers faster risk reduction than perfecting long-term renovations. This reality makes simple, immediate advice the most effective strategy during smoke episodes.
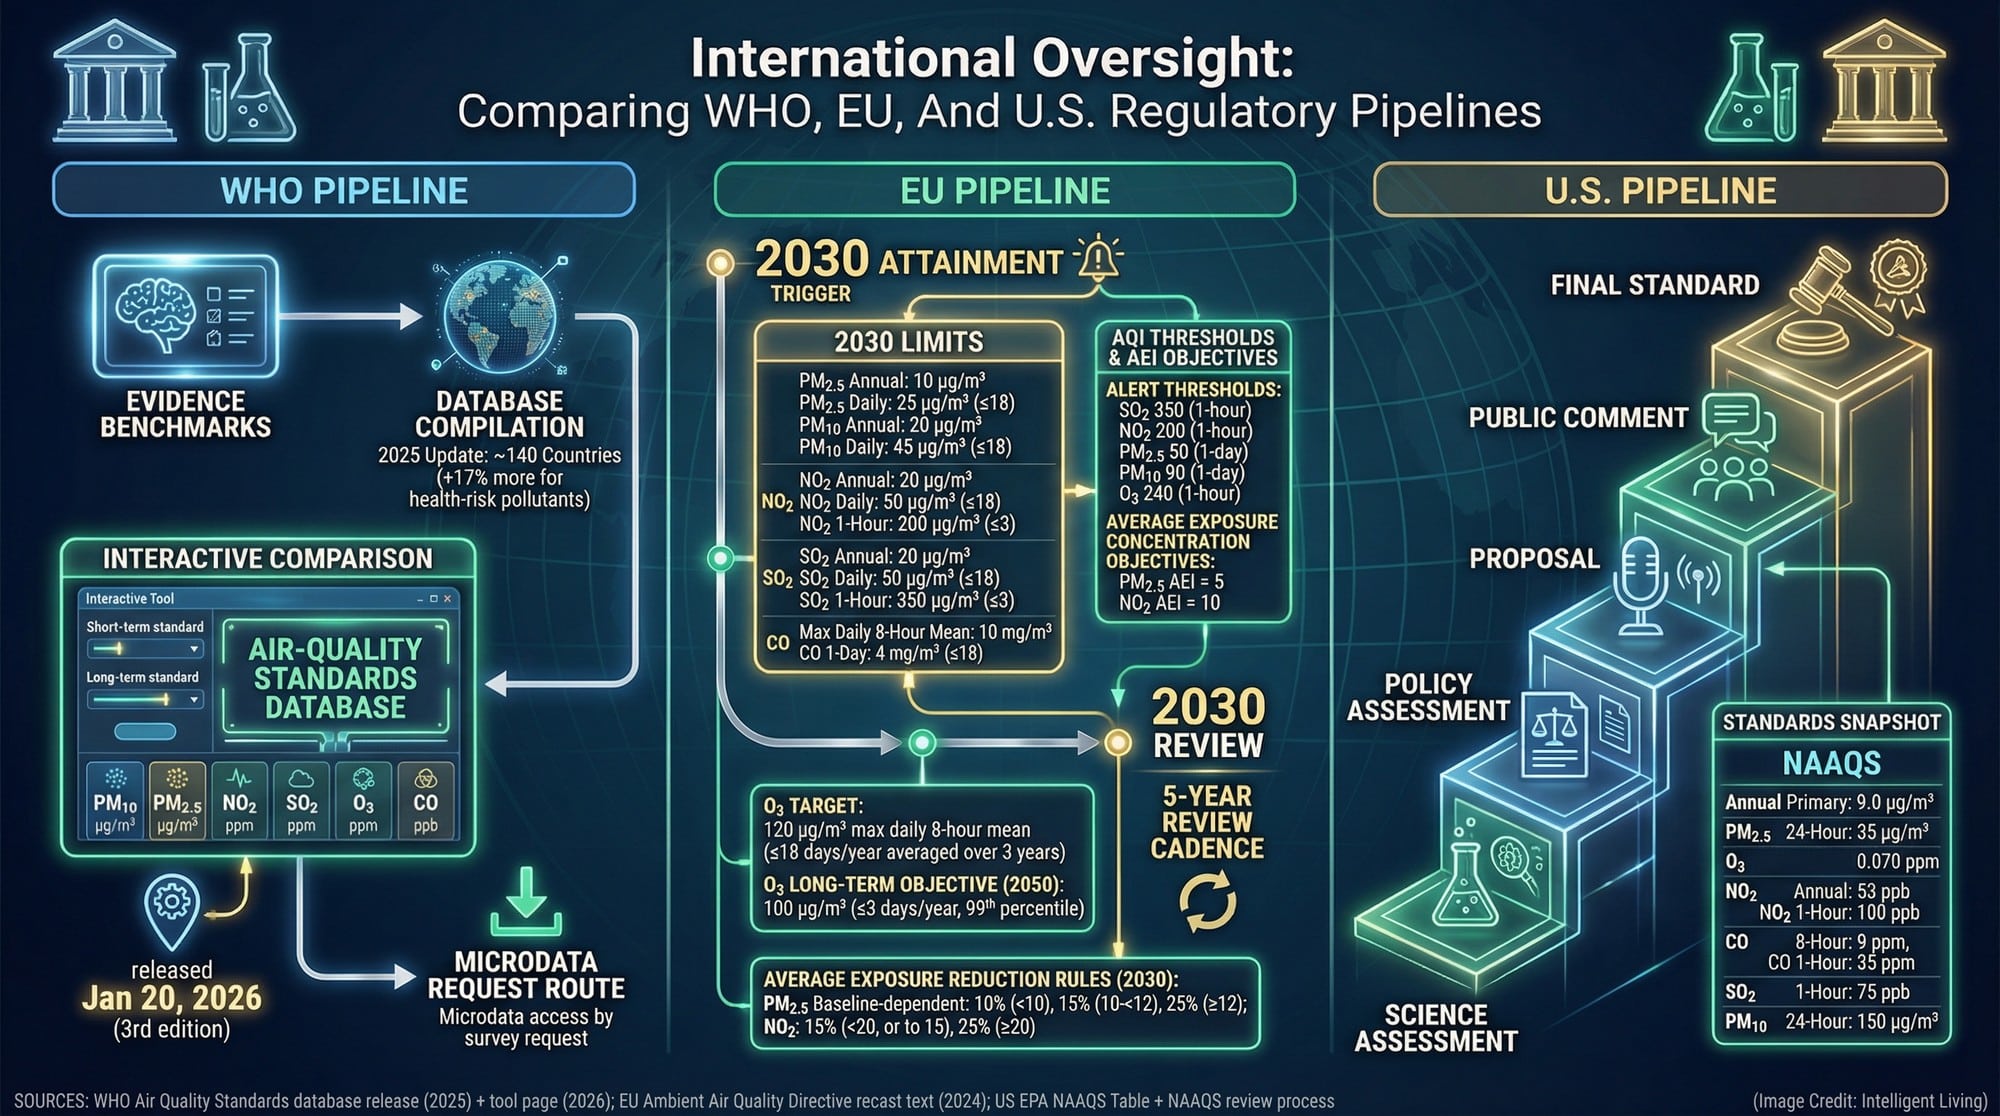
International Oversight: Comparing WHO, EU, and U.S. Regulatory Pipelines
WHO treats the dataset as a maintained tool, not a one-time report. WHO’s toolkit for air-quality standards data describes the pollutant set, the data structure, and the update pathway that keeps the database usable over time.
Analysts can access the spreadsheet behind the interface by requesting WHO air standards microdata for verification and deep-dive research.
European Policy as a Case Study
The European Union shows how standards shift from political ambition into enforceable structure. The recently adopted EU air quality legal framework mandates tighter limit values and establishes clear deadlines for regional compliance.
In effect, the directive treats clean air as something that requires deadlines, reporting, and legal remedies, not just a statement of intent.
How The U.S. Review Process Works
In the United States, revisions follow a science-to-rulemaking pipeline that includes evidence synthesis, advisory review, and formal rulemaking steps. EPA’s NAAQS review process illustrates why standards changes often take years even when science is moving quickly.
That slow pace can be frustrating, but it also creates a paper trail of evidence reviews and public input that makes the process harder to hijack with slogans.
Future Outlook: Driving Global Competition for Cleaner Air Standards
When neighbouring nations tighten annual PM2.5 limits, the political pressure on laggard governments intensifies, as residents utilise comparative data to demand similar protections.
The conversation moves away from abstract commitments and toward the real mechanics of protection, including tighter limits, clearer monitoring, and deadlines that governments can be held to.
What that Looks like in Everyday Exposure
In daily life, this can land in surprisingly ordinary moments, especially when statistical evidence showing mortality spikes during high air pollution days often emerges well before national policies catch up to the science.
A stroller route that felt harmless can start to feel negotiable once someone realises that “legal” does not automatically mean “low risk”, particularly for short-term spikes near traffic corridors.

Closing The Protection Gap: A Global Strategy for Breathable Air
As countries begin treating these standards like a public scoreboard, the incentives for environmental protection shift from abstract promises to measurable accountability. When a neighbouring nation tightens its PM2.5 annual limits, the political cost of maintaining lax regulations rises, especially as residents gain the microdata to prove the human toll of inaction. This ‘race to the top’ creates a momentum that transcends borders, turning individual health evidence into collective policy shifts.
Structural policy shifts eventually manifest in tangible moments, such as genuinely safe stroller routes or sleep routines undisturbed by stagnant air alerts. While the governance loops of the WHO, EU, and U.S. may move slowly, the transparency provided by this database ensures that the paper trail of progress is visible to everyone. Breathable air is a shared right, and using these numbers today is the first step toward securing a cleaner, more resilient future for every community.
Frequently Asked Questions Regarding Air Standards and Personal Safety
What is the Difference Between Guidelines and Laws?
A WHO guideline is a science-based health recommendation, whereas a legal standard is an enforceable limit set by a government that may prioritise economic factors over health.
Does a Strict Limit Guarantee Clean Air?
No. Limits are policy targets; actual air quality depends on local monitoring, enforcement of emissions controls, and geographic conditions like wind or wildfires.
How Frequently is the WHO Database Refreshed?
The database is a maintained instrument, with updates occurring as countries submit new legal texts or validation cycles conclude.
Can the Data Compare Specific City Air Quality?
This tool tracks national legal ceilings. Comparing specific cities requires real-time concentration data from local ground monitoring stations.
What Quick Steps Protect Lungs During Smoke Events?
Prioritise sealing a ‘clean room’, running high-efficiency indoor filtration, and avoiding particle sources like frying or candles to lower immediate exposure.


