
Australia installed 276,011 home batteries in the first six months of 2026, 52 per cent more than in the six months before. They added 8,691 megawatt-hours of storage, more than double the previous half, and took the first year of the federal Cheaper Home Batteries Program to 457,439 installations and 12.9 gigawatt-hours.
The figure that has travelled furthest is a ratio: 153 batteries for every 100 new rooftop solar systems, up from 130. It is a genuine Australian record and one of the fastest rates of household storage uptake recorded anywhere. It is also widely read as something it does not say.
The ratio is not a measure of one product outselling another. It is one count divided by another, and the arithmetic explains most of what looks startling about it. What follows separates the record from the artefact: what was counted, how the subsidy drove it, how much of the half-year was pulled into a single frantic April, and why the two official Australian sources disagree about the same twelve months.
276,011 batteries in six months, and no plateau in sight
The Clean Energy Council’s fifth half-yearly Rooftop Solar and Storage Report, released on 29 September, covers January to June 2026, the first full calendar half-year in which the battery program ran from start to finish.
Installations rose in every quarter, from 70,571 in the September 2025 quarter to 154,140 in the June 2026 quarter, a climb that never reversed. The two middle quarters, derived from the Council’s published half-year totals, come in at about 110,857 and 121,871.
Capacity grew faster than unit numbers: 8,691 megawatt-hours against 4,221 in the previous half, a rise of more than 100 per cent on a 52 per cent increase in installations. The difference is size. The average battery installed in July 2025 was 17.2 kilowatt-hours; by April 2026 it had reached 35.3 before easing to 26.6 in June. Across the first twelve months, the fleet average was 28.2 kilowatt-hours.
Solar was strong on its own terms. Some 180,878 rooftop systems went in, 35 per cent more than a year earlier and the strongest six months since 2021, the year Australian households last set a rooftop record. They delivered 1,894 megawatts, a six-month high. The Council’s previous edition had suggested rooftop solar might have passed its peak; 2026 is tracking above 300,000 installations.
The quarterly peak is sharper than the half-year number suggests. The June 2026 quarter alone accounted for 102,234 systems and 1,079 megawatts, the largest quarter on record, and the Council reports it as a record quarter for rooftop capacity in six of the eight states and territories.
What “153 for every 100” actually measures
Strip the framing away, and it is a division: 276,011 batteries divided by 180,878 solar systems, or 1.53. Multiply by 100 and it becomes a headline.
That matters because the two numbers count different things in different units. Solar is recorded in systems and in kilowatts of generating capacity; batteries in units and in kilowatt-hours of storage. A 10-kilowatt array and a 10-kilowatt-hour battery are not interchangeable quantities, and the ratio does not claim they are. It is a count of installations on each side.
The harder question is why the battery count runs ahead at all. The answer sits in the eligibility rules. To claim the rebate, a household must connect the battery to a solar system, new or already on the roof. Australia has more than 4.4 million rooftop systems installed since 2001. That pool dwarfs the number of solar systems going up in any six-month window, so a ratio above 100 becomes close to arithmetically inevitable once storage is cheap enough to sell at scale.
The Clean Energy Regulator’s own breakdown supports that reading: roughly half of batteries are retrofits to existing solar and roughly half go in with new or upgraded panels.
What the ratio cannot show is the relative size of the two markets. The half-year added 1,894 megawatts of generation capacity and 8,691 megawatt-hours of storage. Those are the numbers that describe how much equipment was built.
| Measure | January to June 2026 | Change |
|---|---|---|
| Rooftop solar systems | 180,878 | Up 35 per cent on the first half of 2025 |
| Rooftop solar capacity | 1,894 MW | Up 41 per cent, a six-month record |
| Home batteries | 276,011 | Up 52 per cent on the second half of 2025 |
| Battery storage added | 8,691 MWh | More than double the previous half |
| Batteries per 100 new solar systems | 153 | Up from 130 |
| Average battery size, June 2026 | 26.6 kWh | Peaked at 35.3 kWh in April |
Source: Clean Energy Council, Rooftop Solar and Storage Report, January to June 2026.
Why the rebate pushes batteries harder than panels
The program began on 1 July 2025 and runs to 2030. It pays no cash. It creates small-scale technology certificates for a battery’s usable capacity, and the installer usually takes assignment of them in exchange for a discount off the quoted price.
The rules are precise, and they shape the market as much as the money does:
- Between 5 and 100 kilowatt-hours of nominal capacity, attached to new or existing solar of no more than 100 kilowatts.
- Certificates issued on the first 50 kilowatt-hours of usable capacity only.
- One battery system per premises, and only on a first claim.
- Listed on the Clean Energy Council’s approved products list and compliant with AS/NZS 5139:2019.
- Technically capable of joining a virtual power plant and installed by an accredited installer.
For the first ten months the discount was flat, at roughly 30 per cent, capped at $18,500. From 1 May 2026 it became a taper: full rate on the first 14 kilowatt-hours of usable capacity, 60 per cent on the next 14, 15 per cent on the stretch to 50, nothing above. The certificate factor fell from 8.4 per usable kilowatt-hour to 6.8, and it now steps down every six months rather than annually, reaching 2.1 by December 2030.
At 6.8 certificates and the $40 clearing house price, the full-rate band is worth about $272 per kilowatt-hour: roughly $2,700 for a 10 kilowatt-hour battery and $3,640 for a 13.5 kilowatt-hour unit, which is where the widely quoted 30 per cent comes from. On 1 January 2027 the factor drops to 5.7, cutting every system’s certificate value by about 16 per cent.
A separate change applies to solar rather than storage, and it is now in force. The federal government announced on 5 August 2026 that systems up to 1 megawatt would become eligible under the Small-scale Renewable Energy Scheme from 1 October 2026, and the Renewable Energy (Electricity) Amendment (Mid-scale Solar) Regulations 2026 took effect on that date, lifting the 100-kilowatt ceiling that defines a small-scale system. The Clean Energy Regulator confirms eligible systems installed from 1 October 2026 qualify, with a fixed five-year deeming period each year to 2030 rather than the declining period small systems use, and notes that applications will not open until mid to late November 2026 while the systems and processes are implemented. Projects of that size typically need at least eight months from design to approval.
Three design choices explain why this moved storage faster than generation. The rebate is open to households that already have panels, so it draws on millions of roofs rather than on the annual flow of new ones. It is large relative to the hardware it discounts, which makes the saving read as decisive. And it arrived after battery prices had fallen far enough to close the gap on a purchase many households had already priced and postponed.
The taper is legible in what people bought. Before 1 May, systems of 28 to 50 kilowatt-hours made up 44.7 per cent of installations. Afterwards that band fell to 21.5 per cent while the 14 to 28 band rose from 36.2 per cent to 60.3 per cent. In two months, the incentive redrew the market it was written for.
| Usable capacity band | Share of installations, July 2025 to April 2026 | Share of installations, 1 May to 30 June 2026 |
|---|---|---|
| Up to 14 kWh | 16.3 per cent | 18.1 per cent |
| 14 to 28 kWh | 36.2 per cent | 60.3 per cent |
| 28 to 50 kWh | 44.7 per cent | 21.5 per cent |
| Above 50 kWh | 2.9 per cent | 0.1 per cent |
Source: Clean Energy Regulator, Quarterly Carbon Market Report June quarter 2026.
How much of the record was pulled forward
A record built against a deadline is still a record, but it is not a run rate, and the first half of 2026 had an unusually sharp deadline inside it.
In April alone, 78,000 installations representing 2.8 gigawatt-hours were approved. Across the program’s first nine months the monthly average had been 40,000 installations and 980 megawatt-hours, so April roughly doubled the pace and nearly tripled the capacity. The regulator found average installation rates on April weekends and public holidays were higher than at any other point in the program, with some installers working straight through them.
The pull-forward concentrated in bigger systems, because bigger systems lost the most support under the taper. That is why the average installed size fell so sharply once the deadline passed.
Solar was dragged along with it. More than 80 per cent of small-scale solar installed in April went onto a roof alongside a battery, against less than half in May and June. April’s 480 megawatts was the strongest single month for small-scale solar on record, in a month that is usually one of the weaker ones.
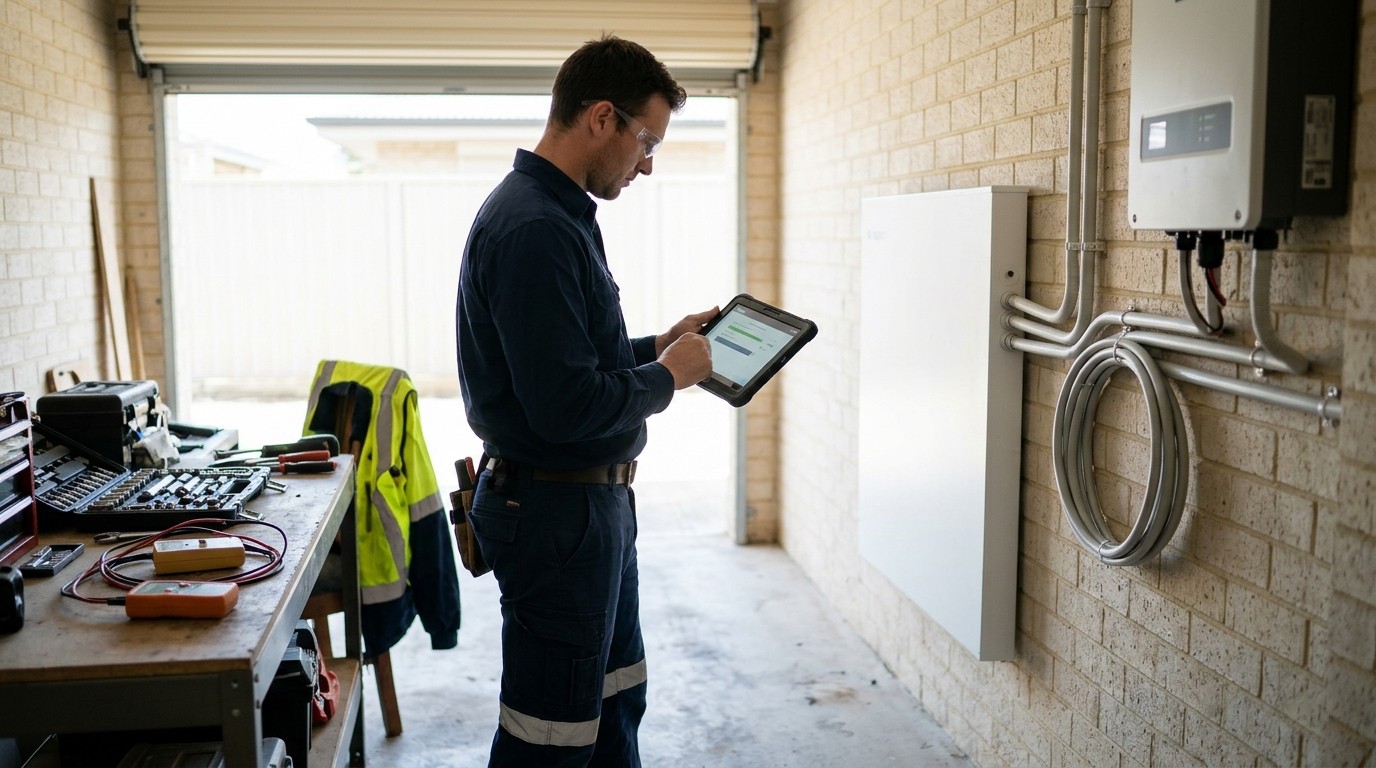
What happened after the deadline is the better signal for the rest of the year. Rates fell back towards pre-surge levels, demand held up, and the average system got smaller. That is the profile of a policy that redistributed activity and reshaped sizing, not one that inflated a market and let it fall over. The second half should still come in below the first, because the first contains a month that will not be repeated.
Where the numbers are softer than they look
Three caveats belong with every figure above. The Clean Energy Council states two of them itself.
The counts are applications, not completed installations. The Council’s figures are based on applications submitted to the Clean Energy Regulator in the period, including some still working through compliance review. Its own note says the data will vary slightly from the regulator’s published figures, which exclude applications that have not met requirements or been completed correctly. Numbers move after publication, and the movement is usually upwards.
The data provider changed. This edition is the first to draw on Green Energy Markets rather than SunWiz, applied retrospectively to all data from January 2019. The Council flags that four of its charts splice the two sources and that before July 2025 the SunWiz series measured batteries as sales rather than installations. It calls this the best available option for capturing historical trends, which is fair. A series joined across two providers and two definitions is serviceable for direction and unreliable to two decimal places.
The two official numbers disagree. For the same twelve months, the Council reports 457,439 batteries and 12.9 gigawatt-hours. The regulator’s June quarter carbon market report puts approved storage at 12.4 gigawatt-hours across more than 438,000 installations at the end of the program’s first year, with more than 500,000 applications received by mid-August. The gap is about four per cent and reflects what each body counts, not a dispute about what happened.
The regulator also shows how fast the figures settle. Its June report recorded 83,000 battery installations approved in the March 2026 quarter; by the time the next set was compiled, that quarter had been revised to 122,000. Anyone quoting a single quarter as final is quoting a draft.
| Clean Energy Council | Clean Energy Regulator | |
|---|---|---|
| What is counted | Applications submitted in the period, including some still in compliance review | Validated and approved installations |
| Program’s first year | 457,439 batteries and 12.9 GWh | More than 438,000 installations and 12.4 GWh |
| Data source | Green Energy Markets, replacing SunWiz from this edition | The regulator’s own registries, with a 12-month certificate creation window |
| March 2026 quarter | 121,871, derived from published half-year totals | 83,000 at publication, later revised to 122,000 |
None of this undermines the story. It sets its limits. Even at the conservative end, the Australia home battery record is not in doubt: the direction of travel is clear and the order of magnitude is settled, and the Council’s figure sits at the top of a range whose floor is the regulator’s. The defensible reading is that Australia passed 450,000 subsidised household batteries within twelve months, give or take a few per cent, and that the tally will keep shifting for a year.
What 153 per 100 does to the grid
The ratio is a marketing number. The figure that matters to the electricity system is 12.9 gigawatt-hours, the storage the first year put behind household metres. The market operator put household battery capacity in the National Electricity Market at roughly 10 gigawatt-hours on 30 June 2026.
The effect is already visible in demand. The regulator reports that the June 2026 quarter set a record for total electricity demand, counting everything generated and consumed, while electricity drawn through the grid sat at its lowest level for that quarter since 2020. Distributed solar more than offset growth from electrification, population and data centre load. Batteries pushed charging into the middle of the day and cut evening demand.
Against the planner’s assumptions, the numbers are running hot. The Australian Energy Market Operator’s 2026 Integrated System Plan projects consumer battery storage in the national market reaching 33 gigawatt-hours by 2029-30 under its Step Change scenario. Held at the current rate, the Council calculates 59.2 gigawatt-hours by then, 79 per cent higher, and enough to pass the plan’s 2049-50 projection of 78 gigawatt-hours around 2032. The Council is candid that this rests on twelve months of data from a market in its first year of subsidy and assumes no change in settings, pricing or saturation. It measures momentum rather than forecasting.
The scale of what has been built is easy to overstate, so the Council is careful about it. Australians have installed 21,979 megawatts of rooftop solar since January 2019, close to the roughly 22 gigawatts of coal-fired generation still operating. That compares capacity, not energy: rooftop solar runs only in daylight at a far lower capacity factor, so 22 gigawatts of it produces roughly a quarter of the annual energy of 22 gigawatts of coal. What it does capture is that households, not utilities, have become the largest single builder of new generation capacity in the market.
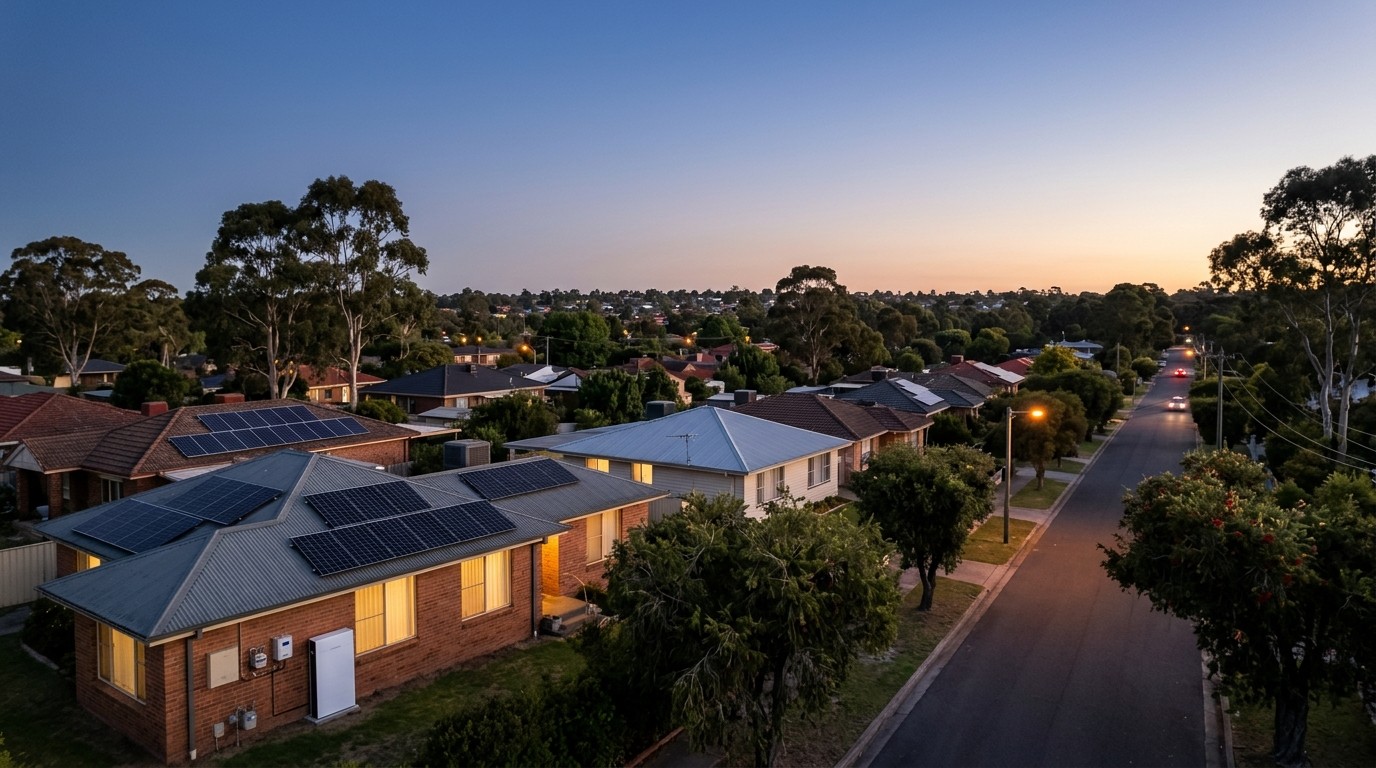
The largest gap is not in how many batteries get installed. It is in what they are permitted to do. Most run for one purpose, storing the household’s own solar for after dark, which is a sound reason to buy one and leaves most of the system value untouched. A battery that never exports cannot:
- Ease a constraint on the local network before an upgrade is needed;
- Answer a price spike at the evening peak;
- Hold the grid steady through a system event; or
- Earn anything beyond the bill it trims.
Flexible midday tariffs and virtual power plants are the mechanisms meant to change that. The Council is running a Flexibility Value Study to quantify what coordination would be worth, building on modelling that put about $22 billion of consumer savings at risk if distributed energy is installed without being coordinated.
What households do with the electricity once stored is a separate and less comfortable question. A CSIRO-led study of 35 Australian homes with large batteries found evidence of a rebound effect, in which stored solar made power feel abundant and households stopped conserving. The emissions consequence depends on what generates the electricity a battery displaces, which is why the same device can be a modest climate positive in one grid and a wash in another.
Who is buying, and where
Subsidised capacity sits where the solar fleet sits. New South Wales holds the largest share, with Queensland and Victoria following, tracking those states’ cumulative rooftop solar totals since 2019 of 6,692, 5,713 and 4,414 megawatts.
The household profile is narrower than the installation figures suggest. Energy Consumers Australia’s 2026 survey of household barriers found that 16 per cent of households with solar already have a battery, and a further 47 per cent are researching or considering one. Against a fleet of more than 4.5 million rooftop systems, that is roughly one in six today, with a potential market several times the size of the one that has bought.
Choice widened quickly, and so did the regulatory surface around it. Approved battery models rose from 1,259 to 3,406 in six months. Approved sellers under the New Energy Tech Consumer Code reached 2,389 nationally, and complaints against them rose faster than sales did: 567 cases opened against 317 in the previous half, 88 resulting in compliance action, and 143 recorded instances of non-compliance. A third concerned sales documentation such as quotes and contracts, the point where a rebate-led purchase is most likely to go wrong. For households partway through a decision, the practical advice is to get the quote, the capacity in kilowatt-hours and the certificate value in writing before paying a deposit.
Frequently Asked Questions
How many Australian homes have a battery?
More than 700,000 homes and small businesses, against more than 4.5 million with rooftop solar, according to the Clean Energy Council. The Council’s cumulative series puts the installed fleet at 728,667 at 30 June 2026, counting every battery in its dataset rather than only those subsidised under the current program. Roughly one in six solar households has one. The Council’s own headline measure is that rooftop solar is in about one in every 2.5 Australian homes, alongside about one in seven with a battery.
Do batteries now outsell solar in Australia?
No, and the ratio does not say they do. It compares a count of battery installations with a count of solar installations, not revenue, capacity or market value. Because the rebate requires a battery to be attached to solar, and because millions of Australian roofs already have panels, the battery count can exceed new solar without storage displacing generation.
How much is the home battery rebate worth?
At 6.8 certificates per usable kilowatt-hour and a certificate price near $40, the full-rate band is worth about $272 per kilowatt-hour on the first 14 kilowatt-hours. That is roughly $2,700 for a 10 kilowatt-hour battery and $3,640 for a 13.5 kilowatt-hour one, or around 30 per cent of installed cost. The rate falls to 5.7 on 1 January 2027 and 2.1 by December 2030.
How long will a 10 kilowatt-hour battery last?
Residential lithium systems are generally warranted for about a decade or a stated number of charge cycles, whichever arrives first, with usable capacity degrading gradually rather than failing outright. Size matters more than the calendar here: the program’s fleet average is 28.2 kilowatt-hours, a 10 kilowatt-hour battery is well below it, and in a CSIRO survey 37 per cent of owners said their system was too small. Our guide to solar with and without a battery works through the trade-offs.
What are the regulations for home battery storage?
Systems must comply with AS/NZS 5139:2019 for battery installation safety, whose first amendment was mandated by most regulators in January 2026, and with AS/NZS 4777.2 for inverter grid connection. Batteries claiming the rebate must appear on the Clean Energy Council’s approved list, be installed by an installer accredited through Solar Accreditation Australia, meet state and territory electrical safety law, and be capable of joining a virtual power plant. The Council’s standards work in the half-year also covered AS 5438, which will set interoperability requirements between inverters and devices from different manufacturers.
The bottom line
Australia’s home battery record is real, large and partly an artefact of timing. The 276,011 batteries, the 8,691 megawatt-hours of new storage and the ratio of 153 installations for every 100 new solar systems are all inside the published data. So is a single April that carried most of the growth, a rebate change that reshaped how large a battery people bought, a switch in data provider, and a four per cent disagreement between the two official sources about the same twelve months.
Read properly, the ratio describes something more interesting than a product race. It describes a country that spent a generation putting panels on roofs and has now begun adding the missing half of the system, mostly by retrofitting houses that were already generating. The constraint on what happens next is no longer the number of installations. It is whether those batteries are ever allowed to do more than shift a household’s own solar from noon to nightfall.


