
Global supply chains are entering a period of unprecedented accountability as regulatory frameworks move away from self-reported sustainability pledges toward geolocated, physical evidence. The European Union Deforestation Regulation (EUDR) serves as the primary catalyst for this shift, demanding that every product entering the market be linked to a specific patch of Earth that has remained free of forest loss. The transformation turns the physical landscape into a living audit trail, where compliance is no longer a matter of administrative intent but a science of verifiable observation.
Technological precision resides at the core of this new era through the Sentinel-2 satellite constellation. Multispectral instruments provide a continuous, high-resolution record of forest health and land-use changes across the globe, offering a level of transparency that was previously cost-prohibitive for most organisations. Integrated into monitoring, reporting, and verification (MRV) systems, Sentinel-2 data allows regulators to cross-reference coordinates with spectral signatures to confirm that production plots remain intact.
Establishing a robust technical backbone is essential for companies aiming to meet the strict 2026 enforcement deadlines. Effective strategies involve more than just capturing imagery; they require a deep integration of geolocation polygons with time-series analytics and automated quality controls. Mastering these technical nuances ensures that deforestation-free claims are supported by a reproducible and auditable data pipeline.

Quick Facts: Sentinel-2 and EUDR Compliance Essentials
- EUDR enforcement timeline: A recent political agreement revised the main company deadline to 30 December 2026, creating a short window to build robust data infrastructures.
- Geolocation mandate: Every operator must submit exact plot coordinates, either as polygons for land areas larger than four hectares or a single point for smaller plots.
- Verification methods: Remote sensing and Copernicus Earth Observation data are explicitly recognised as supporting evidence for compliance checks.
- Sentinel-2 resolution: The system captures 13 spectral bands at 10, 20, and 60 metres, covering visible, near infrared (NIR), and shortwave infrared (SWIR) wavelengths.
- Revisit frequency: The two satellites provide a five-day revisit cycle at the equator, ensuring time-series monitoring for deforestation alerts.
- Surface reflectance data: Level-2A imagery offers atmospherically corrected Bottom of Atmosphere (BOA) reflectance values, which are essential for accurate land-change detection.
The Geolocation Mandate: How Spatial Precision Enforces EUDR Accountability
The EUDR sets a new global precedent for transparency in supply chains by requiring companies to prove that their products do not originate from recently deforested land. Official traceability and geolocation guidance clarify that operators must collect and retain data for every production plot that feeds into regulated supply chains. The geolocation requirement makes deforestation risk a measurable question tied to specific coordinates instead of a general allegation.
Unlike earlier sustainability pledges, the EUDR enforces accountability through spatial precision. Every operator must record exact coordinates of production plots inside the EU Information System, creating a digital chain of custody that ties each shipment to a specific patch of Earth. Plots exceeding four hectares for major commodities like cocoa, coffee, soy, and palm oil must be submitted as polygon geometries that outline the full boundary of each plantation. Smaller plots may utilise a single coordinate point, but the guiding principle remains the same: every product must link to a defined place on a map.
Spatial detail transforms compliance from document-based to data-based. Regulators can overlay declared polygons with satellite imagery and land cover layers to verify forest conditions and determine whether any clearing occurred after the regulation’s cut-off date. Recital language regarding space data explains how Earth observation systems are expected to support this form of geolocation-driven due diligence.
Geolocation is the foundation of every modern MRV system. Integrating remote sensing capabilities allows continuous monitoring instead of one-time inspections. Authorities can use an evolving digital record of environmental status linked to precise coordinates, while companies can track land-use risk across their portfolios. Transitioning to spatial precision lays the groundwork for automated compliance monitoring and a new era of environmental accountability.

Sentinel-2 in Plain Technical English
To understand why Sentinel-2 plays such a critical role in EUDR compliance, it helps to break down what the satellite actually does. Sentinel-2 operates as part of the Copernicus Earth Observation programme, providing high-resolution optical imagery of Earth’s surface. The constellation consists of two satellites, Sentinel-2A and Sentinel-2B, which orbit in the same path but are phased so that they image the same area every five days.
Each Sentinel-2 satellite is equipped with the MultiSpectral Instrument (MSI), which captures imagery in 13 spectral bands. The multispectral bands cover visible light alongside multiple near-infrared and shortwave infrared channels. Analysts utilise these data streams to assess critical environmental indicators:
- Vegetation health and canopy density.
- Soil moisture levels across diverse landscapes.
- Bare ground exposure in agricultural zones.
- Smoke or ash presence in recently disturbed areas.
The 10-metre resolution visible and near-infrared bands are used to detect vegetation coverage and canopy structure, while the 20-metre red-edge and SWIR bands help identify subtle changes in plant stress, deforestation, or land degradation. Atmospheric bands at 60 metres help correct interference from clouds and haze. Practitioners leverage this spectral combination to generate widely used vegetation indices, including NDVI for plant greenness and NBR for highlighting burnt or recently cleared areas.
Unlike standard photographs, Sentinel-2 imagery is quantitative. Each pixel represents calibrated reflectance values at known wavelengths. Level-2A surface reflectance correction transforms these raw readings into corrected ground values, accounting for the atmosphere between the surface and the sensor. This process provides scene classification layers that flag clouds, shadows, water, and snow.
Because of its global coverage, open data policy, and analysis-ready products, Sentinel-2 has become the workhorse for forest monitoring, agricultural mapping, and environmental audits. Governments, researchers, and companies can track land-use patterns with a level of reliability that was once impossible without high-cost commercial satellites, making Sentinel-2 a central building block in most satellite-based compliance and biodiversity systems.

The MRV Mechanism: From Pixels to Proof
Sentinel-2’s true power lies in how it fits into the MRV pipeline. Aggregating Sentinel-2 data with EUDR geolocation requirements transforms satellite imagery into measurable, verifiable evidence of land-use activity. The MRV process progresses through specific data-driven phases that convert raw pixels into compliance-grade insight.
Step 1: Define the Area of Interest
Each EUDR submission begins with a plot polygon or point coordinate. This boundary defines the exact area to be monitored. Analysts use this geometry to pull all Sentinel-2 data that covers that region, ensuring every observation corresponds to a declared production area rather than an arbitrary scene.
Step 2: Build a Time Series
Next, analysts compile a time-series dataset using Sentinel-2 imagery from multiple dates. Because the satellites revisit the same area every five days, the system can detect gradual or sudden changes in vegetation cover. By comparing data across months or years, teams can document whether a site remained forested or was cleared after the EUDR cut-off date for deforestation.
Step 5: Validate and Package Evidence
After potential changes are flagged, analysts review imagery manually and cross-check results with additional datasets such as land cover maps, radar observations, or high-resolution commercial satellite images. Verified findings are packaged into an Evidence Report containing annotated imagery, timestamps, processing parameters, and explanations of any uncertainties. This digital packet can be linked to the Due Diligence Statement required under the EUDR so that auditors have a clear, reproducible trail of how deforestation risk was assessed.
Step 6: Maintain the Audit Trail
Each evidence packet contributes to a long-term compliance archive. These records form the foundation for inspections, regulator requests, and automated alerts.
The result is a living, traceable geospatial MRV stacks that bind satellite and acoustic monitoring data for supply chain biodiversity proof, creating a digital twin of environmental performance that can evolve over time as new evidence is captured.
By following this structured pipeline, Sentinel-2 becomes more than a monitoring tool. It acts as a trusted compliance instrument capable of supporting sustainability claims at scale. The outcome is a more transparent, evidence-based approach to environmental accountability where every pixel can be traced and questioned.

Optimising the MRV Stack: Spectral Strengths and Operational Limitations of Sentinel-2
Sentinel-2 excels at detecting broad-scale deforestation, crop expansion, and burn scars. The 10-metre resolution allows analysts to identify most land-cover changes larger than a basketball court. Furthermore, the short revisit cycle provides the temporal density required to monitor seasonal cycles, expansion fronts, and repeated clearing attempts. For many tropical and subtropical landscapes, this combination provides a reliable signal whenever dense forest canopy gives way to bare soil or planted fields.
There are, however, limitations that MRV designers ignore at their own risk. Persistent cloud cover, especially in equatorial regions, can obscure imagery for weeks or months. Understory degradation, selective logging, and small canopy gaps may not trigger a strong signal in 10-metre optical imagery, particularly when operators remove only a small share of trees at a time. Topographic shadows in mountainous areas or seasonal flooding can also mimic disturbance signatures if not interpreted carefully.
Enhancing Reliability through Multi-Sensor Integration and Radar Cross-Checking
Optical satellites cannot see through clouds or operate at night. Operational gaps emerge when an MRV system relies exclusively on Sentinel-2, leaving it vulnerable to coverage blind spots. To compensate, many organisations combine Sentinel-2 with radar-based missions such as Sentinel-1, which can detect structural changes in vegetation under cloudy conditions and during both day and night passes. Understanding both the strengths and the blind spots of Sentinel-2 helps decision-makers treat satellite outputs as structured evidence rather than absolute truth.
Practical Implementation Checklist for 2026 Build-Out
The EUDR enforcement date gives companies a defined window to move from pilot projects to operational satellite MRV. A practical roadmap helps compliance teams build systems that are both technically sound and auditable.
- Map Every Supply Plot: Gather GPS coordinates for all relevant farms, ranches, or production areas. Convert these coordinates into polygon geometries and points that match EUDR guidance on plot geolocation and size thresholds.
- Establish a Sentinel-2 Data Pipeline: Set up automated access to Sentinel-2 Level-2A surface reflectance from Copernicus data hubs or cloud platforms. Design workflows that clip each scene to your polygons so that only relevant pixels enter your analysis environment.
- Integrate Cloud and Quality Masking: Use the Scene Classification Layer to remove cloud, shadow, and cirrus pixels. Add quality rules so that scenes with excessive cloud cover or low sun angles are excluded from automated change detection routines.
- Run Time-Series Analytics: Generate NDVI, NDMI, and NBR layers for each polygon and date. Use these indicators to identify disturbance trends, including sharp drops in greenness, increases in bare soil, or sudden burn signatures.
- Develop Standardised Evidence Templates: Create templates for Evidence Reports that capture screenshots, time stamps, index values, and interpretation notes in a consistent structure. Include fields for uncertainty assessments and any supporting ground observations.
- Maintain Secure, Searchable Archives: Store all imagery, scripts, and Evidence Reports in secure repositories with version tracking and access logs. Index these records by polygon identifier, DDS reference, and date so that regulators and internal audit teams can retrieve them quickly.
- Combine Optical and Radar Sources Where Needed: Integrate Sentinel-1 radar data in regions with heavy cloud cover or complex forest structures. Use cross-checking between optical and radar indicators to strengthen confidence in deforestation alerts and to reduce false positives.

Planetary Dashboards: Satellite Data as Global Environmental Infrastructure
The Sentinel constellation is not only a compliance engine; it is becoming part of global environmental infrastructure. Each orbit adds to a shared dataset that helps scientists and policymakers measure the planet’s biological health. The same imagery that verifies EUDR plots can support biodiversity restoration programmes, climate adaptation planning, and nature-positive investment strategies.
The Copernicus Land Monitoring Service already uses Sentinel-2 data to map land cover and ecosystem dynamics across Europe. Systematic mapping produces vital reference layers for soil moisture, vegetation conditions, and habitat change. Long-term tracking of carbon-rich landscapes, including peatlands and floodplain forests, supports analyses of carbon stock and flow, where satellite evidence helps quantify how living systems lock away or release carbon over time.
Integrating Spectral Evidence with Distributed Sustainability Passports
Sentinel-2 data paired with deforestation-free digital product systems transforms satellite monitoring into a distributed sustainability infrastructure.
Digital product passports use QR scans to build biodiversity trust from farm to store, turning geolocated evidence and DDS records into information that can travel through supply chains. Over time, this connected network of satellites, registries, and product passports enables continuous environmental accounting instead of sporadic reporting.
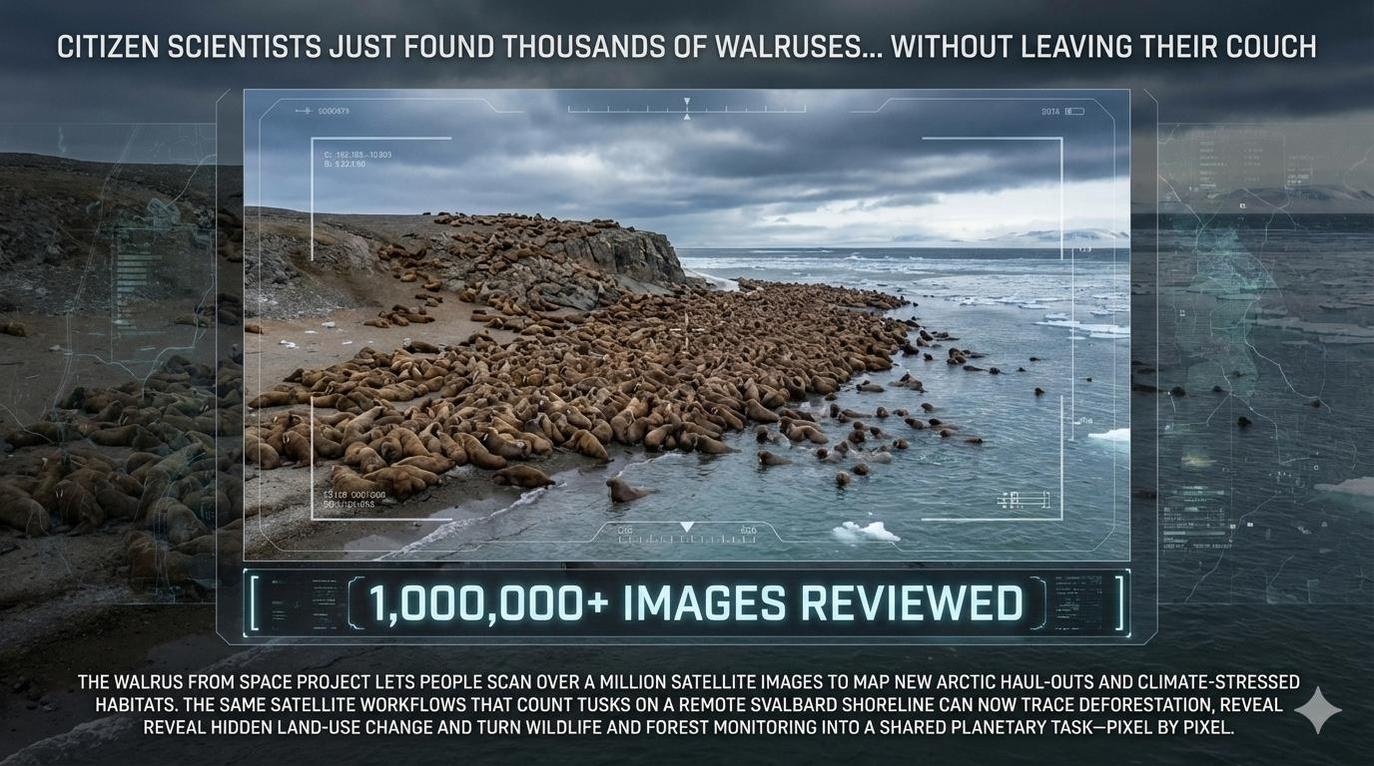
Walrus From Space as Proof of Concept for Biodiversity Monitoring
A striking example of satellite technology’s ecological potential comes from the Arctic. In 2024 and 2025, scientists and volunteers working on the Walrus from Space initiative used high-resolution satellite imagery to identify a massive new walrus haul-out on Norway’s Svalbard archipelago. The Svalbard haul-out discovery highlights how satellite images revealed thousands of Atlantic walruses resting on remote shorelines that had not been systematically monitored before.
The project’s design combines very high-resolution imagery from Maxar’s WorldView satellites with human interpretation and local validation. This population monitoring model explains how WWF and the British Antarctic Survey plan to count walruses across the Arctic by pairing satellite scenes with contributions from citizen scientists. A report on the Svalbard gatherings gives non-specialist readers a sense of the scale of these gatherings and the climate pressures they face.
Although Sentinel-2 does not match the sub-metre resolution of commercial systems used to identify individual animals, it excels at tracking habitat changes that matter for species survival. The constellation can monitor snow-free haul-out areas, vegetation shifts on tundra islands, and coastal disturbances across polar regions. Targeted high-resolution imagery paired with this broad perspective helps researchers understand the intersection of habitat availability, sea ice decline, and human activity.

From Pledges to Proof: Securing Environmental Integrity through Data Pipelines
Navigating the transition toward verifiable environmental integrity requires a fundamental shift in how organisations manage supply chain data. The move toward Sentinel-2-based monitoring signals the end of the “slogan era” in sustainability, replacing vague commitments with transparent, traceable pipelines of proof. As regulatory dashboards begin to ingest geolocated coordinates in real time, the ability to produce high-fidelity spectral evidence becomes the primary metric of corporate accountability.
Preparation for the 2026 enforcement window involves building infrastructure that can scale with the complexity of global commodity markets. Organisations that prioritise the development of automated MRV systems today will be better positioned to handle the rigours of regulatory scrutiny while fostering deeper trust among citizens and brands. Transforming deforestation rules into verifiable protection ensures that the link between commerce and conservation remains visible, measurable, and permanent.
Technical Insights: Satellite MRV and EUDR Compliance Standards
What defines reliable satellite MRV for EUDR?
Reliability stems from using calibrated, Level-2A surface reflectance data combined with precise geolocation boundaries and documented, repeatable processing methods.
Does satellite imagery replace standard due diligence?
No, satellite evidence acts as a technical supplement to supply chain documentation and risk assessments, providing physical verification for legal land-use records.
How does spatial resolution impact regulatory compliance?
Sentinel-2’s 10-metre resolution identifies most broad clearings, though higher-resolution commercial sensors are sometimes required for small-scale gap detection or disputed boundaries.
What strategies mitigate gaps caused by cloud cover?
Effective systems utilise advanced cloud-masking algorithms and integrate Sentinel-1 radar data to maintain monitoring continuity during persistent weather events or night passes.
How often should production plots be monitored?
Quarterly reviews represent a baseline for low-risk areas, while monthly or bi-weekly checks are recommended for high-risk regions experiencing significant deforestation pressure.


