
The global manufacturing landscape is currently undergoing a seismic shift as the robot-to-worker ratio becomes the definitive benchmark for industrial competitiveness. While traditional production models relied heavily on manual labor, the modern factory floor is increasingly defined by the seamless integration of industrial robots designed to augment human precision.
Analyzing global surges in robot density exposes a definitive chasm between pioneers and late adopters in industrial modernization. Economies that prioritize factory automation are finding new ways to maintain high-quality manufacturing standards while navigating rising labor costs.
By examining the latest trends in industrial robotics, we can better understand how these machines are reshaping the very fabric of global trade and regional economic power. This article provides a data-driven exploration of the top 20 countries currently leading the charge in robotics integration. From the rapid ascent of Asian tech hubs to the steady refinement of European engineering, the following sections detail the metrics, regional shifts, and technological breakthroughs defining the AI milestones that are powering the 2026 automation wave. We will dive deep into why certain nations have reached extreme density levels and what these figures signal for the future of the global workforce.
Comparing global automation efforts requires a standardized metric; robot density provides this parity by normalizing data across diverse industrial structures and country sizes. The latest World Robotics datasets provide the foundation for a full Top 20 ranking for 2023, supported by a 2024 update showing which nations are accelerating fastest.
The rankings reveal a world where automation leadership is concentrated in a handful of economies, led by South Korea, Singapore, China, Germany, and Japan. Market concentration remains extreme, as five dominant economies—China, Japan, the United States, South Korea, and Germany—now control nearly 80% of the world’s robotic infrastructure.
Recent coverage of emerging factory humanoids, such as Hyundai’s plans to deploy humanoid robots in a US factory, shows where automation may move next, even as traditional industrial robots continue to shape today’s manufacturing landscape. In the sections that follow, we will walk through the key facts, explain exactly what the metric does and does not measure, and then break down the Top 20 countries by robot density in 2023, with a clearly labeled 2024 update for the front-runners.

The Global Automation Snapshot: Key Robotics Statistics and Trends
- Global Robot Density, 2024: Global automation intensity reached a record average of 177 robots per 10,000 manufacturing workers in 2024, signaling an unrelenting modernization of factory floors worldwide, according to the World Robotics 2025 executive summary on industrial robots.
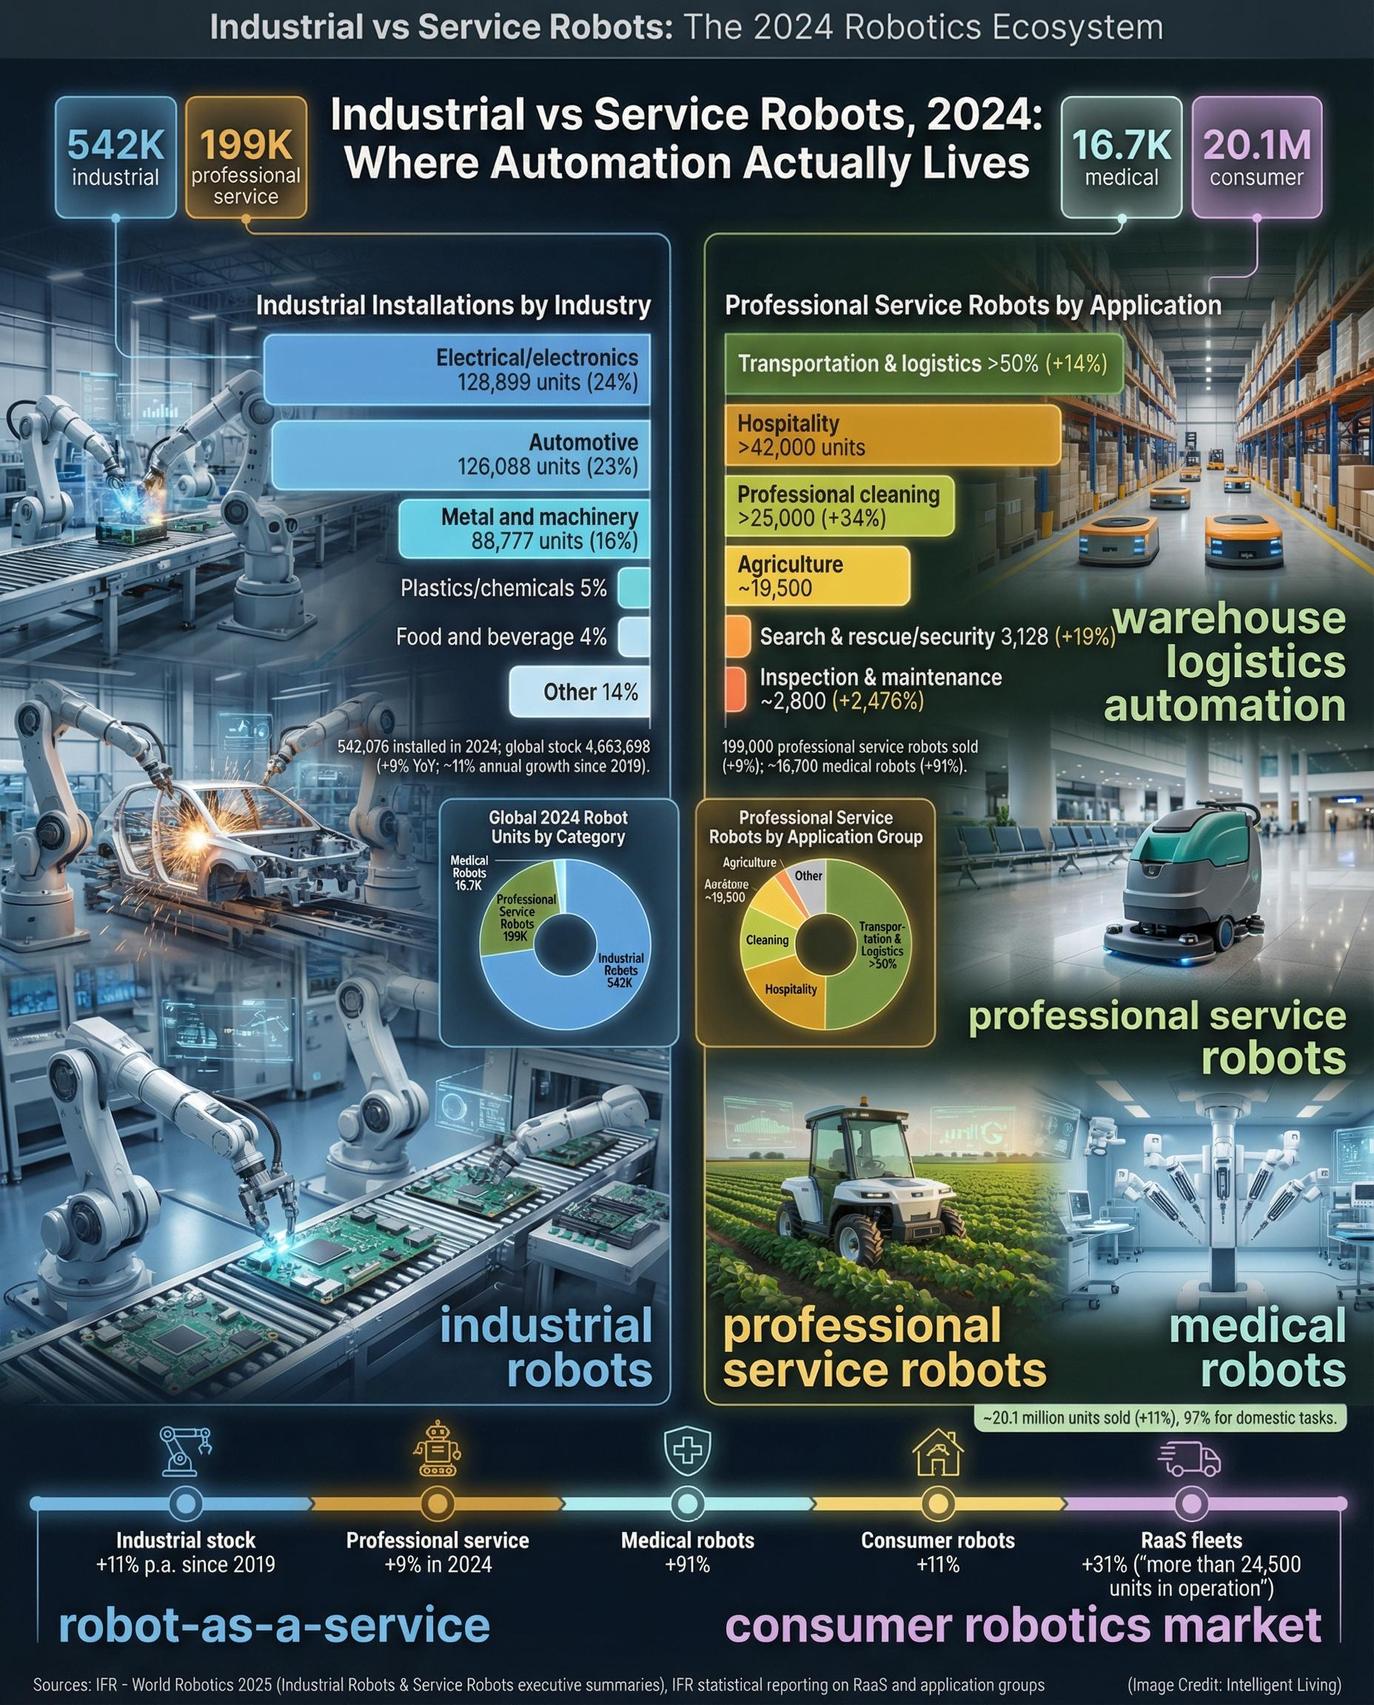
- Asia’s Automation Dominance: Industry data confirms that 542,000 robots were deployed globally in 2024, with Asian markets securing three-quarters of these installations.
- Concentration Among Major Economies: Market concentration remains extreme, as five dominant economies—China, Japan, the United States, South Korea, and Germany—now control nearly 80% of global robot installations.
- Skewed Density Levels: South Korea (1,012), Singapore (770), and China (470) far exceed the global average, showing the uneven distribution of automation capacity.
- Industrial Robots in Operation: By 2024, factories worldwide operated an estimated 4.6 million robots, highlighting the long-term integration of automation technologies over the last decade.
- Rising Service Robotics: More than 199,000 service robots were sold in 2024, including nearly 16,700 medical robots, signaling a rapid expansion beyond traditional manufacturing roles.

Defining Robot Density: The Methodology Behind Global Automation Rankings
How Robot Density Turns into a Robot-to-Worker Ratio
Translating robot density into a tangible robot-to-worker ratio requires a straightforward inversion of these standardized figures:
Robot density = number of industrial robots in operation in manufacturing per 10,000 employees in manufacturing.
Multiple analytical frameworks exist for evaluating industrial robotics, ranging from annual shipment volumes to gross installation spending. The IFR uses it as a core measure of “degree of automation” in manufacturing, alongside tables of production, imports, exports, and sector breakdowns, as summarized in the World Robotics industrial robot statistics maintained by the International Federation of Robotics.
Practical Applications of the Robot-to-Worker Ratio
Converting density into an intuitive robot-to-worker ratio is straightforward:
- A density of 1,000 robots per 10,000 workers equates to roughly one robot for every 10 manufacturing employees.
- A density of 200 robots per 10,000 workers corresponds to approximately one robot for every 50 workers.
This simple visual comparison allows readers to grasp the physical presence of automation on the factory floor. For example, in 2023:
- South Korea recorded 1,012 robots per 10,000 manufacturing workers, so its factories operate at about one robot per 10 workers.
- Spain had 174 robots per 10,000 manufacturing workers, which is closer to one robot per 57 workers.

Why Robot Density is the Best Available Global Proxy
The primary advantage of robot density lies in its ability to quantify how seamlessly automation integrates into daily manufacturing routines. There are many ways to talk about industrial robots. You could look at the number of new units shipped each year, the total number of robots installed in a country, or spending on automation equipment. All of those statistics matter for industry analysts, but they are less helpful for readers who want to understand how robots are changing the relative intensity of factory automation across countries.
Robot density has a few clear advantages:
- It normalizes for manufacturing employment: Measuring robots per 10,000 employees quantifies the automation intensity of a nation’s manufacturing sector rather than merely tracking gross installation volume. A smaller country with a very automated base can outrank a much larger one that still relies heavily on manual labor.
- It is updated consistently and publicly: The IFR releases density data every year through press releases that describe how global factory robot density has doubled over seven years and through executive summaries of the World Robotics yearbooks, which keep the underlying numbers transparent and comparable.
- It covers a broad set of countries: The IFR now reports robot density for around forty economies and highlights the global Top 20, which is enough to draw meaningful patterns across Asia, Europe, and North America without cherry-picking special cases.
Most importantly, robot density captures how deeply automation is woven into everyday factory operations. It goes beyond headline-grabbing pilot projects or isolated car plants. This metric reflects the repeatable strategic choices companies make regarding task allocation between human workers and robotic systems.
What Robot Density Misses and How to Read it Safely
For all of its strengths, robot density is still an imperfect measure. Four critical constraints must be considered when interpreting these leadership rankings to avoid oversimplifying the automation landscape. There are at least four important limitations to keep in mind while looking at the leaderboard:
- It measures only industrial robots in manufacturing: The metric does not include service robots in logistics, hospitals, hotels, agriculture, or homes, including high-profile deployments such as a smart field hospital staffed almost entirely by robots.
- It is heavily influenced by industry mix: Countries with large automotive and electronics sectors tend to show much higher robot density than those focused on food processing, textiles, or basic materials.
- It reflects the denominator as much as the numerator: In very automated economies, the number of people directly employed in manufacturing can shrink as production becomes more capital-intensive, pushing density higher even if robot growth is slow.
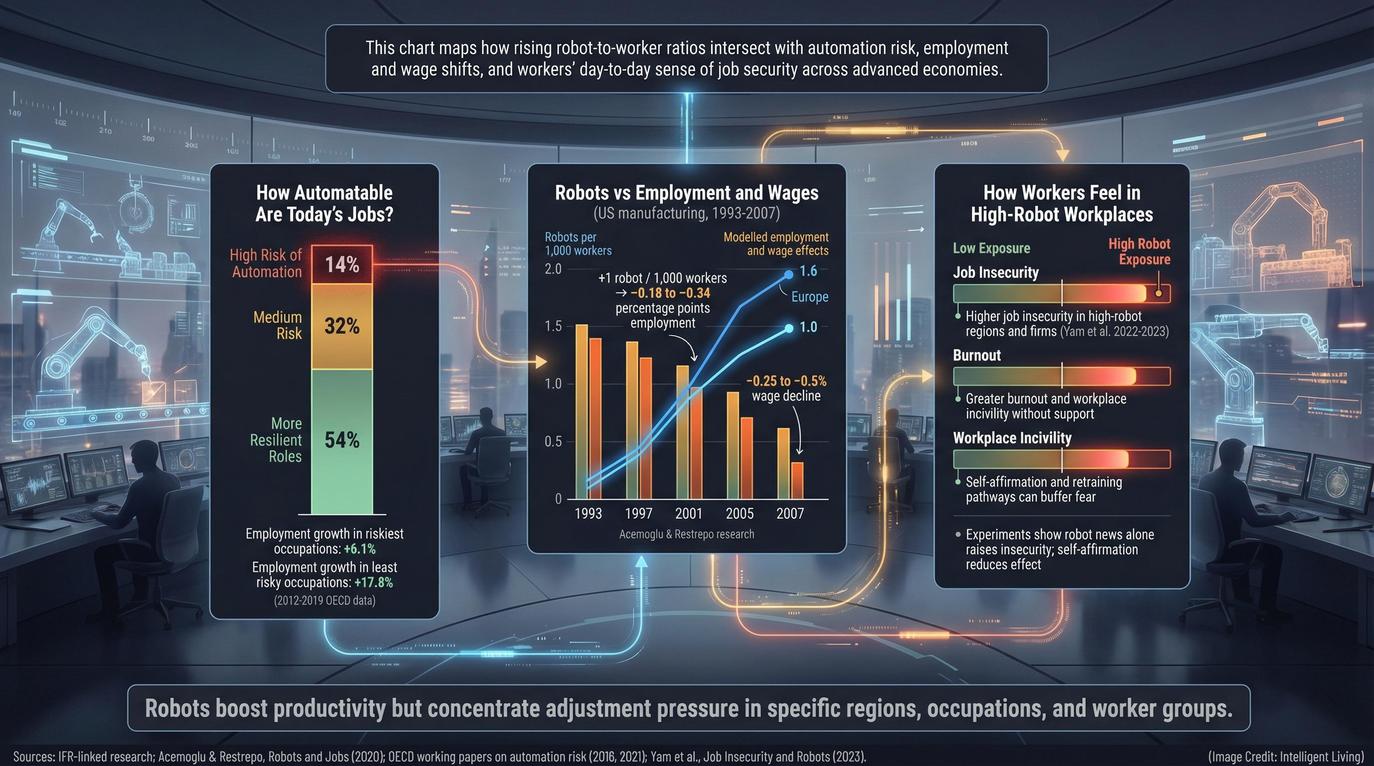
- It does not directly tell you about job quality or wages: Studies tracking US labor market trends tend to find nuanced, sector-specific patterns regarding the employment effects of robotics.
The Top 20 Leaderboard (2023 Full Ranking)
How to Read the Rankings
The Top 20 list below is based on 2023 robot density figures from the International Federation of Robotics. A few points about how to interpret this table:
- The ranking is by robot density in manufacturing, not by total robots.
- 2023 is the latest year with a fully visible Top 20 breakdown.
- Some entries combine countries. “Belgium and Luxembourg” appears as a single entry.
Robots Installed Per 10,000 Employees in Manufacturing (2023)
| Rank | Country or Economy | Robot Density (Robots per 10,000 Manufacturing Workers) | Approximate Workers per Robot |
|---|---|---|---|
| 1 | South Korea | 1,012 | ~10 |
| 2 | Singapore | 770 | ~13 |
| 3 | China | 470 | ~21 |
| 4 | Germany | 429 | ~23 |
| 5 | Japan | 419 | ~24 |
| 6 | Sweden | 347 | ~29 |
| 7 | Denmark | 306 | ~33 |
| 7 | Slovenia | 306 | ~33 |
| 9 | Switzerland | 302 | ~33 |
| 10 | United States | 295 | ~34 |
| 11 | Chinese Taipei (Taiwan) | 294 | ~34 |
| 12 | Netherlands | 264 | ~38 |
| 13 | Austria | 245 | ~41 |
| 14 | Italy | 228 | ~44 |
| 15 | Canada | 225 | ~44 |
| 16 | Belgium and Luxembourg | 224 | ~45 |
| 17 | Czech Republic | 207 | ~48 |
| 18 | Slovakia | 201 | ~50 |
| 19 | France | 186 | ~54 |
| 20 | Spain | 174 | ~57 |
Global Robotics Dynamics: Regional Automation Leaders and Growth Hubs
Key Regional Shifts to Watch
- Regional momentum is most visible in Asia, where tech-centric nations occupy the highest density tiers through aggressive robotics adoption.
- Europe forms a broad automation cluster driven by automotive and precision manufacturing.
- North America maintains steady adoption but trails the top automation hubs.
- 2024 widened global density gaps as Asia captured most new robot installations.
Strategic Clustering in High-Value Manufacturing Hubs
Robot density patterns show clear geographic clustering. South Korea and Singapore maintain extreme density levels due to electronics and high-value manufacturing, while China rises quickly as automation becomes central to its long-term industrial strategy.
Europe’s middle band reflects decades of incremental robotics adoption. The operational stock of industrial robots exceeded 4.6 million units in 2024, with China adding nearly 300,000 new robots that year alone.
Drivers of Modernization: A Decade of Accelerating Industrial Robot Adoption
What Drove a Decade of Accelerating Robot Adoption
The preceding decade witnessed industrial robots evolving from niche specialized tools into indispensable standard equipment for modern production. Robot density in the mid-2010s sat at less than two-thirds of today’s level.
Asia’s surge is the defining story of this period. China became both the largest producer and largest consumer of robots as aging demographics and strategic industrial policies accelerated adoption.
Variations in labor demographics and economic composition dictate the speed at which diverse nations scale their automation capacity. Various regional strategies have emerged to accelerate this transition:
- Automotive and electronics-heavy economies deploy robots readily because these sectors benefit most from extreme mechanical precision.
- Asian hubs like China, South Korea, and Singapore leverage heavy government subsidies and dedicated industrial parks.
- European nations focus on integrating robotics to upgrade existing manufacturing infrastructure and maintain quality.
These diverse approaches reflect the localized needs of manufacturing sectors as they move toward full-scale industrial modernization.
The Next Frontier: Sustainability, Humanoid Robots, and Technological Innovation
Robots, Sustainability, and the Coming Humanoid Shift
Resource optimization through robotics yields immediate sustainability dividends by stabilizing manufacturing quality and minimizing scrap. Digital automation also enhances energy management in real time.
Manufacturers are increasingly leveraging robotics to achieve environmental goals through several key pathways:
- Reducing industrial scrap through high-precision material handling.
- Stabilizing production quality to minimize energy-intensive rework.
- Supporting circular workflows through IoT-powered recycling systems and robotic sorting technologies.
Humanoid Robotics and the Evolution of Task Automation
However, because industrial robots draw significant electricity, a comprehensive energy strategy is now essential for truly green automation. The emergence of humanoid robots provides a new experimental pathway for automating tasks that remain challenging for traditional multi-axis systems. Platforms such as Walker S2 and Hyundai’s early deployment plans illustrate how humanoids may augment robot density metrics by expanding what tasks can be automated.
Human-Centric Innovation and the Future of Automation
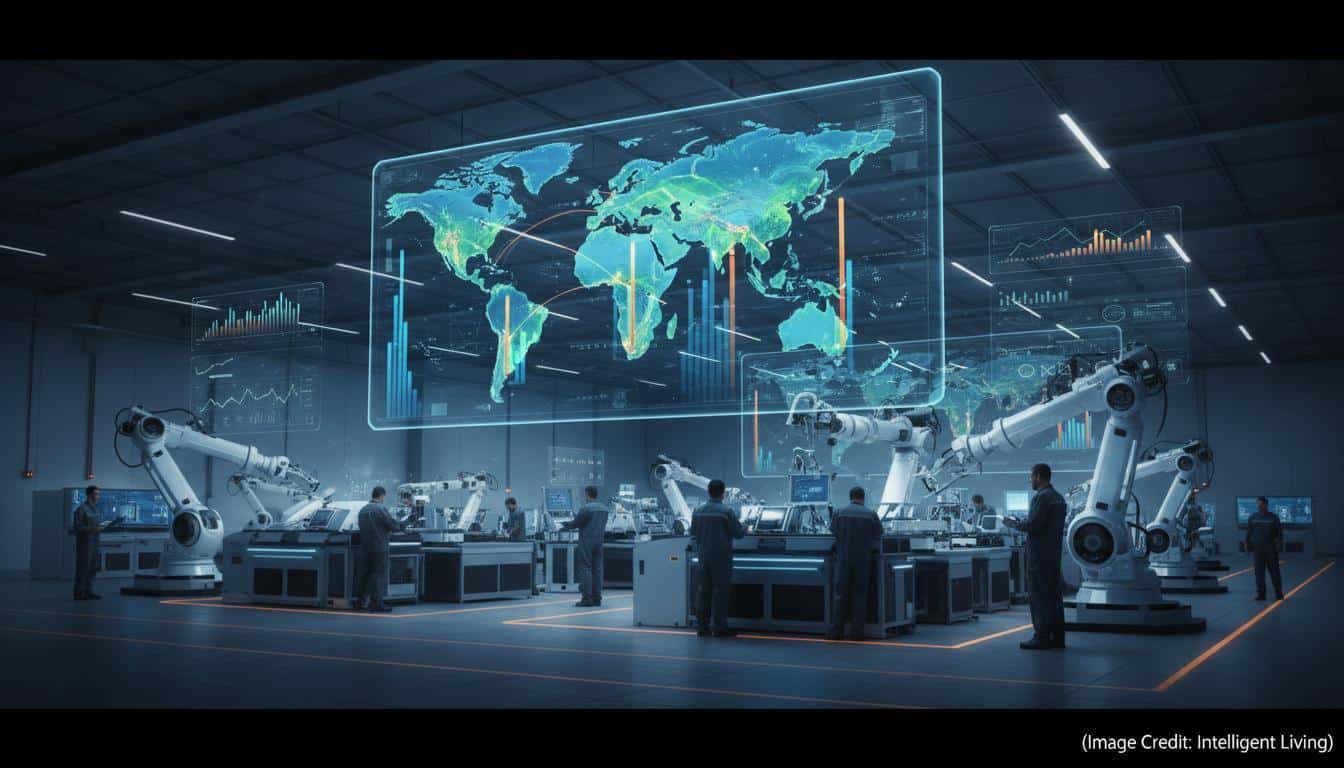
The trajectory of global robot density underscores a shift toward a more capital-intensive and technologically resilient manufacturing sector. As nations like South Korea and Singapore push the boundaries of the robot-to-worker ratio, the conversation is moving past simple displacement toward sophisticated human-robot collaboration.
These advancements ensure that while machines handle repetitive and high-precision tasks, human roles are elevated to focus on oversight, maintenance, and complex problem-solving. Future-proofing manufacturing infrastructure requires a focus on the environmental dividends of robotics, including waste reduction and precision energy management.
Factories that embrace digital automation are better positioned to implement circular economy workflows and meet stringent sustainability targets. Ultimately, the rise in industrial robots signifies a broader commitment to building a more efficient, sustainable, and capable global production infrastructure.
Expert Insights: Frequently Asked Questions on Global Robotics
Which country currently leads the world in robot-to-worker ratios?
South Korea maintains the top position globally, operating with a density of over 1,000 robots per 10,000 employees, which equates to roughly one robot for every ten human workers.
How does robot density impact local job markets in manufacturing?
Robots typically replace high-risk or repetitive tasks, which allows manufacturers to transition their human workforce into more technical and specialized roles involving robot programming and system maintenance.
What is the difference between industrial robots and service robotics?
Industrial robots are programmable machines used strictly for manufacturing tasks like welding and assembly, whereas service robots assist humans in fields such as healthcare, logistics, and hospitality.
What drivers account for China’s rapid ascent in global automation rankings?
China’s rapid ascent is driven by massive national industrial policies and subsidies aimed at modernizing its manufacturing base to counter aging demographics and maintain global export dominance.
Can small economies compete with larger nations in factory automation?
Yes, smaller nations like Singapore and Slovenia often rank highly because they host specialized, high-tech industries like electronics and automotive manufacturing that require extreme precision and automation.
Are service robots and AI software included in robot density figures?
No, robot density measures only industrial robots used in manufacturing and excludes service robotics or software-based RPA systems.


