
That digital box on the side of your house might not be the bill-slasher you expected, according to a recent open-access Empirical Economics study. While most families assume a smart meter arrival guarantees automatic savings, the reality of how advanced metering infrastructure affects your monthly electric bill is far more complex.
Researchers analyzing South Korea’s Power Planner smart metering service found that electricity usage feedback doesn’t always lead to lower costs. Instead of a uniform drop, some households saw their energy consumption rise while others achieved significant savings. The deciding factor wasn’t just the real-time energy data on the screen but the household’s baseline usage patterns before the feedback arrived.
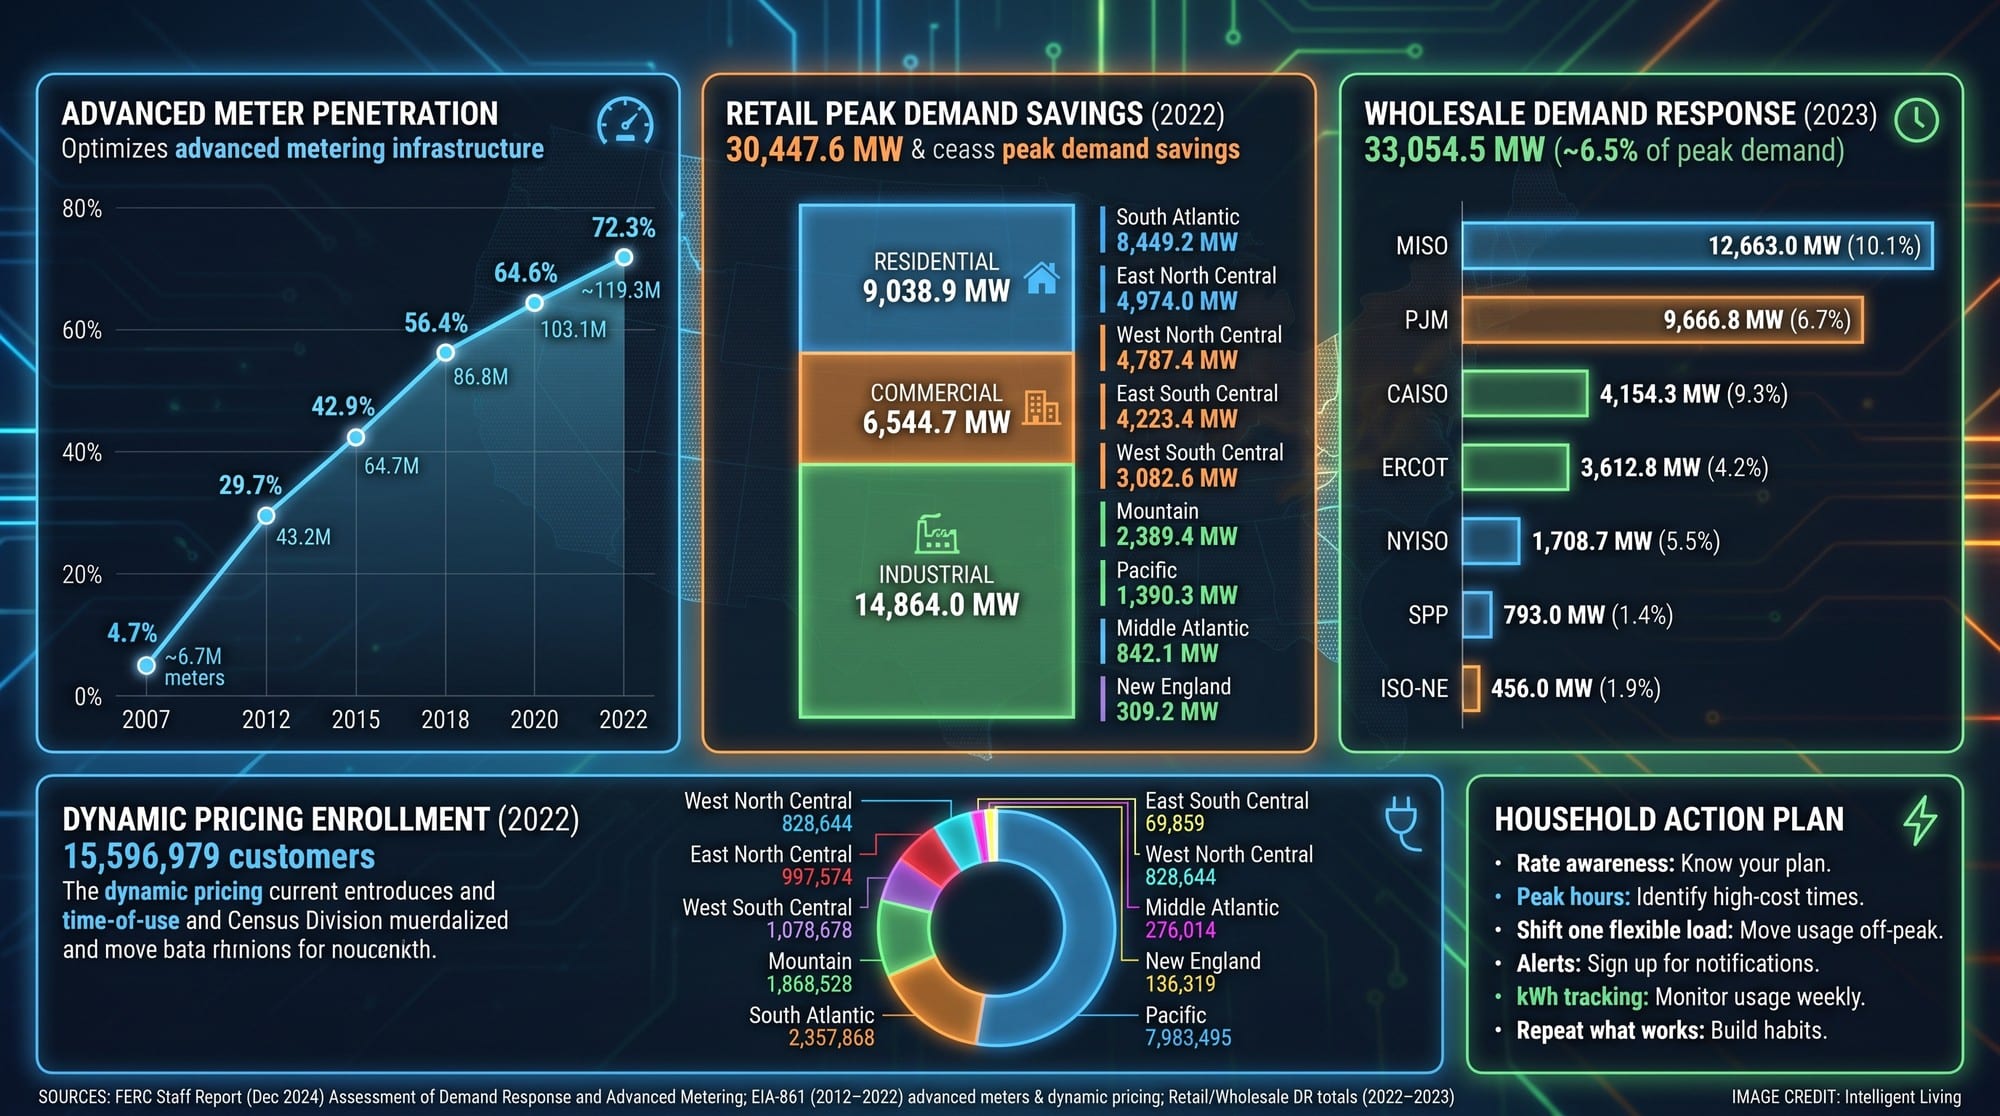
Understanding how to lower your electric bill with a smart meter requires looking past the raw interval data. For millions of residents, the United States has more than 119 million advanced metering infrastructure installations, making this digital measurement a standard part of modern life. Success comes from learning how to interpret these signals to manage demand response effectively.
Think about a small apartment where the biggest energy draws are just a laptop and a kettle; here, seeing that real-time data might just feel like a bit of reassurance. In a larger home where cooling, electric heating, or an EV charger runs on a schedule, the same data can feel like a warning light. The same numbers can lead to opposite choices.

Strategic Data Analysis: Key Insights from Global Smart Meter Studies
Recent Breakthroughs in Smart Meter Research and Energy Efficiency
Analyzing Advanced Metering Infrastructure Data and Tiered Pricing Models
Spanning from 2017 to 2019, the South Korean Power Planner research data encompasses 3,632 residents. This analysis provides a rare, non-simulated look at how a live smart metering program interacts with actual tiered electricity pricing.
Power Planner was originally built for customers with advanced metering infrastructure, starting as a pilot in mid-2017 before growing into a full rollout by 2019.
To make the findings accurate, researchers pulled from a massive pool of users. They made sure the group represented different regions, which is important because things like local weather and house types change how much energy people use every day.
Addressing the complexities of tiered block pricing was central to the research. Under this model, the marginal price fluctuates based on individual energy consumption, turning the cost per kWh into a moving target. Instead of treating price as a clean independent variable, the analysis uses price-block indicators to capture the household’s position on the tariff.
Smart Meter Study Quick Facts: Power Planner, kWh, Peak Hours, and Demand Response
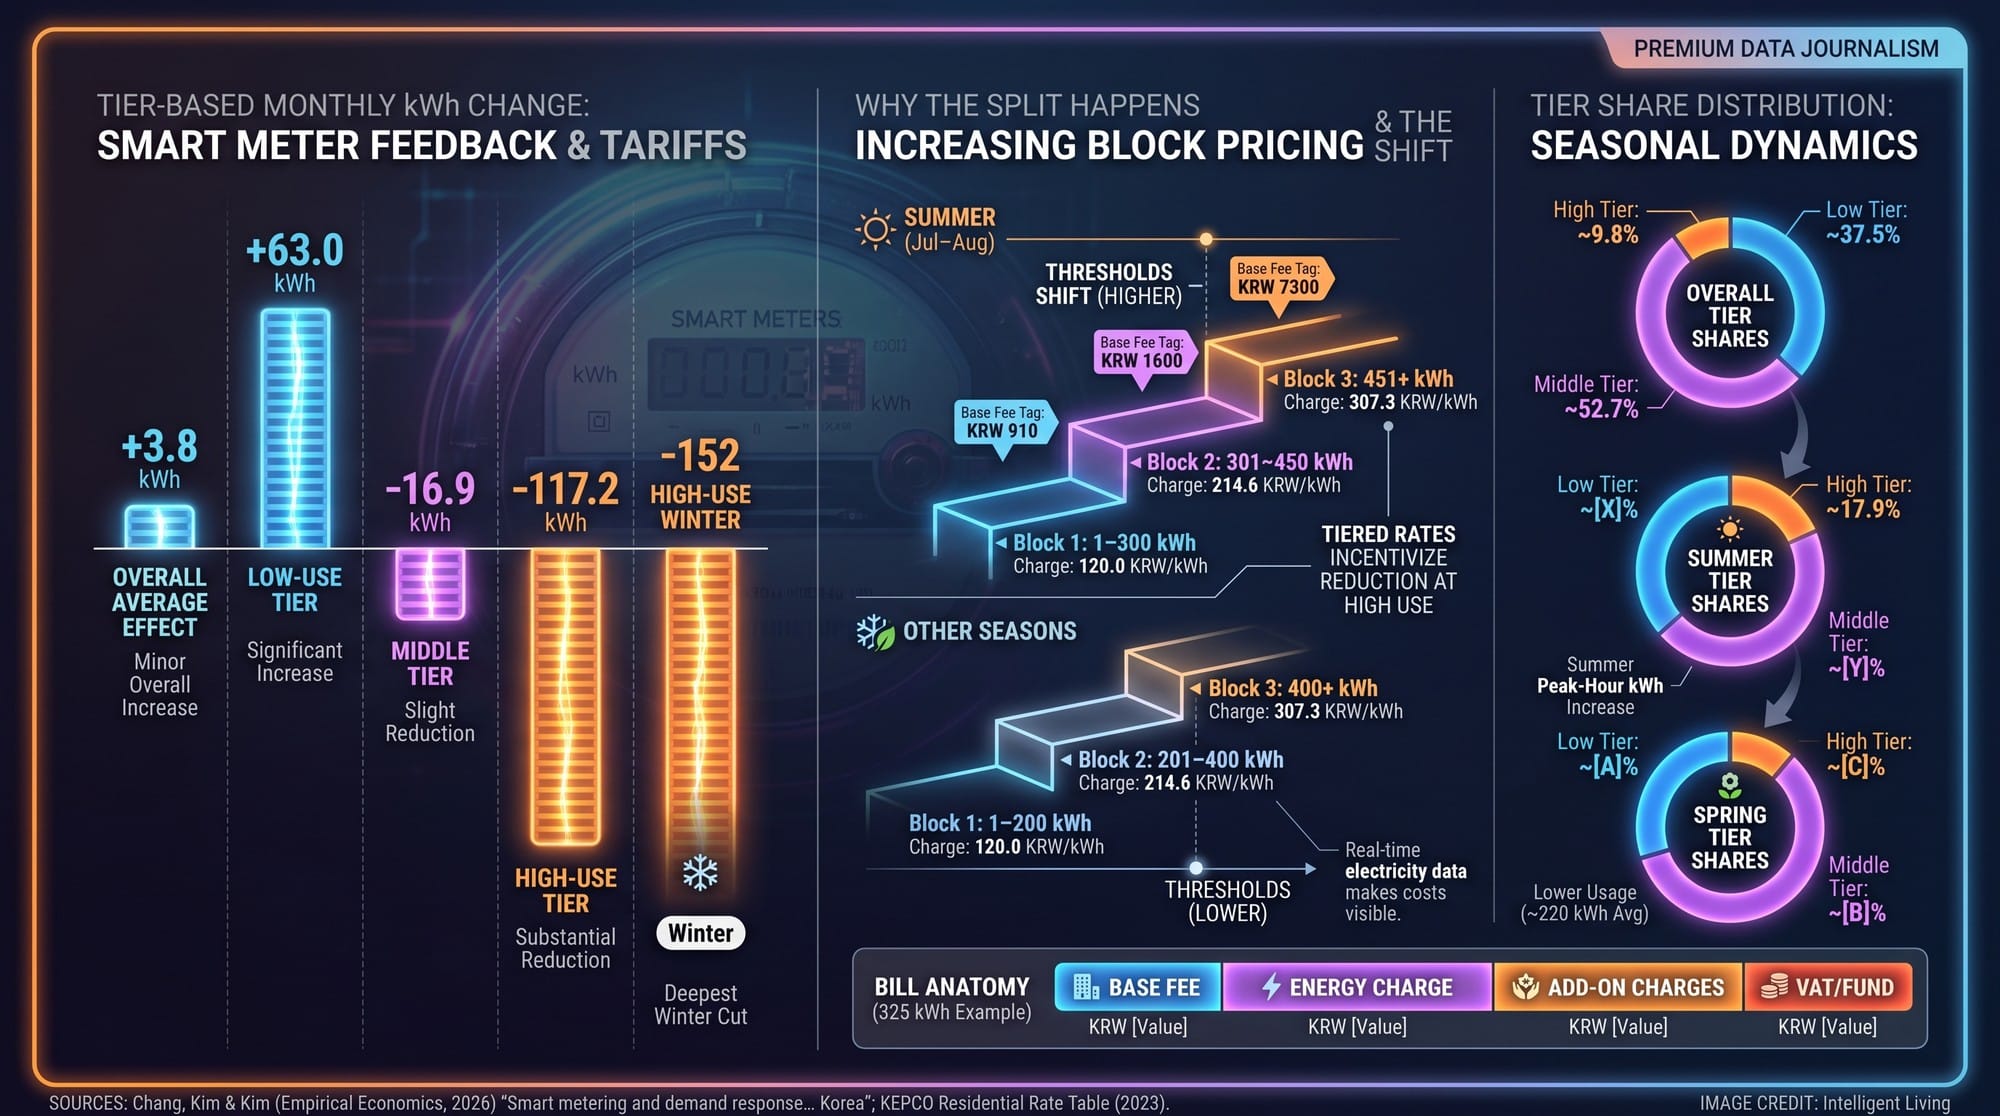
The headline result is simple but unexpected. Average monthly electricity use slightly increased after households adopted the service. Research findings challenge the conventional belief that information alone guarantees savings, instead highlighting the critical role of pricing design and behavior.
- Low-usage households actually increased their total electricity use.
- Middle-tier users achieved a slight reduction in their monthly totals.
- High-use households cut consumption by over 100 kilowatt-hours per month.
These findings suggest that winter months offer the greatest potential for high-usage families to see triple-digit reductions. These specific numbers show how monthly energy habits changed once families started seeing their feedback, and the results depend heavily on how much power they were using to begin with.

The Behavioral Economics of Energy Savings: Why Results Vary By Tier
The numbers below are the shortest path to what the study actually found. They describe changes in monthly electricity consumption after households used Power Planner feedback, and they differ sharply by baseline tier.
Treat the kWh figures as average directional shifts, not promises for every home. Weather swings, household size, and heating or cooling equipment can change outcomes, which is part of why the study emphasizes baseline usage patterns.
- Study published January 8, 2026 in Empirical Economics.
- 3,632 Korean households analyzed between January 2017 and May 2019.
- Low-use tier increased electricity consumption by roughly 63 kWh per month.
- Middle tier decreased around 16.9 kWh per month.
- High-use tier decreased about 117.2 kWh per month, with winter reductions reported around 152 kWh.
- Program tied to real-time usage feedback, billing estimates, and neighbor comparisons.
- Context: demand response as shifting peak-hour electricity use programs aim to reduce or shift electricity during peak hours, matching the Federal Energy Regulatory Commission’s definition of demand response as changes from normal usage in response to prices or incentive payments.
One detail that helps readers interpret the list is that the overall estimate is small compared with the tier-specific shifts, which is why the average result can look counterintuitive at first glance. Another is that the largest reductions appear where electricity is already expensive and usage is already high, which is also where households often have the most flexible waste to cut.
Smart Meter Feedback in Korea: The Split and the Power Planner Tool
The Surprising Split: Low Users Up, High Users Down
How Increasing Block Tariffs Impact Your Monthly kWh Costs
Electricity pricing in South Korea uses increasing block rates, meaning the price per kilowatt-hour rises as usage climbs. A kilowatt-hour, often shortened to kWh, is simply a measure of how much electricity is consumed. Think of it as counting buckets of energy, where more buckets in a month can push the household into a more expensive tier.
The Rebound Effect: Why Real-Time Energy Data Can Push Usage Higher
You might notice this drift in simple, everyday moments. Imagine a home that usually skips the dryer to save money; they might start using it more often if their mid-month update shows they are still under budget. This change isn’t irrational; it is a direct response to a newfound sense of budget space. The same psychology shows up with home batteries that make electricity feel free, where researchers found total household consumption rising even as grid imports fell.
Homes already sitting in the lowest price bracket often react differently to real-time data. Social comparison feedback frequently triggers a behavioral shift for families starting below the community average. Excessive reassurance often dampens the motivation to reduce energy consumption.
Strategies for Significant Cost Reduction in High-Consumption Households
A warm week where cooling runs longer than expected can trigger a sharp mid-month jump in projected cost. This visibility often pushes subtle decisions that don’t feel dramatic. You might shift dishwashing to later hours or shorten a second cooling cycle, yet these small moves add up over a full month.
Families who use a lot of power have a bigger reason to watch the clock. In many areas, crossing into a higher usage ‘block’ means every extra kilowatt-hour costs more money. For these homes, the app can function like a speedometer that stops the bill from feeling abstract.
What Power Planner Actually Does
Real-Time Electricity Tracking for Proactive Bill Management
The platform provides real-time usage, bill estimates, and neighbor comparisons in one interface. Automated alerts trigger whenever your energy consumption drifts beyond a set target. This gives you the critical window needed to change course before the billing cycle ends.
The Power Planner tool hooks directly into your meter to provide instant updates. Smart meters are digital devices that record electricity usage in intervals, often hourly or shorter, and transmit that data to utilities and, increasingly, to customers.
Researchers found that setting goals and earning rewards made a huge difference. This setup turns ‘saving energy’ into a real game instead of a vague promise, which is important because most people ignore their power use until a big bill shows up in the mail.
Optimizing Peak Hour Behavior with Automated Usage Nudges
Power Planner highlights peak consumption periods and encourages shifting flexible use to off-peak windows. That matters for both household budgets and for grid operations, because many households tend to use electricity at the same time.
It is not necessary for the program to turn life upside down to have an effect. A single shifted appliance cycle can be enough to change the bill in a tiered system, especially when a household sits near the edge of a higher block.

Peak Hours, Demand Response, and a Comfort-First Off-Peak Habit
Peak Hours and Demand Response, Explained like Rush Hour
Navigating Peak Versus Off-Peak Hours on Time-of-Use Plans
Think of peak hours as the electrical version of rush hour. Demand hits its daily high in the late afternoon and evening as people return home to cook, turn on lights, and adjust their HVAC systems.
During extreme weather, this surge translates into significant bill pressure and seasonal surges in grid demand, though the pattern exists in almost every developed region.
You can think of demand response as a way for families to help keep the power grid steady. By moving your heavy chores to different times, you help prevent blackouts and can often lower your own rates. Deploy targeted demand response tactics by identifying peak-hour spikes through real-time energy data to shield your budget from high-tariff periods.
Why Grid Flexibility is Becoming a Household Topic
In broader planning, the International Energy Agency treats demand response as grid flexibility because electrification and variable renewable power make peaks harder to manage. In plain terms, flexibility means the grid works better when some loads can move, even slightly, instead of piling up in the same narrow window.
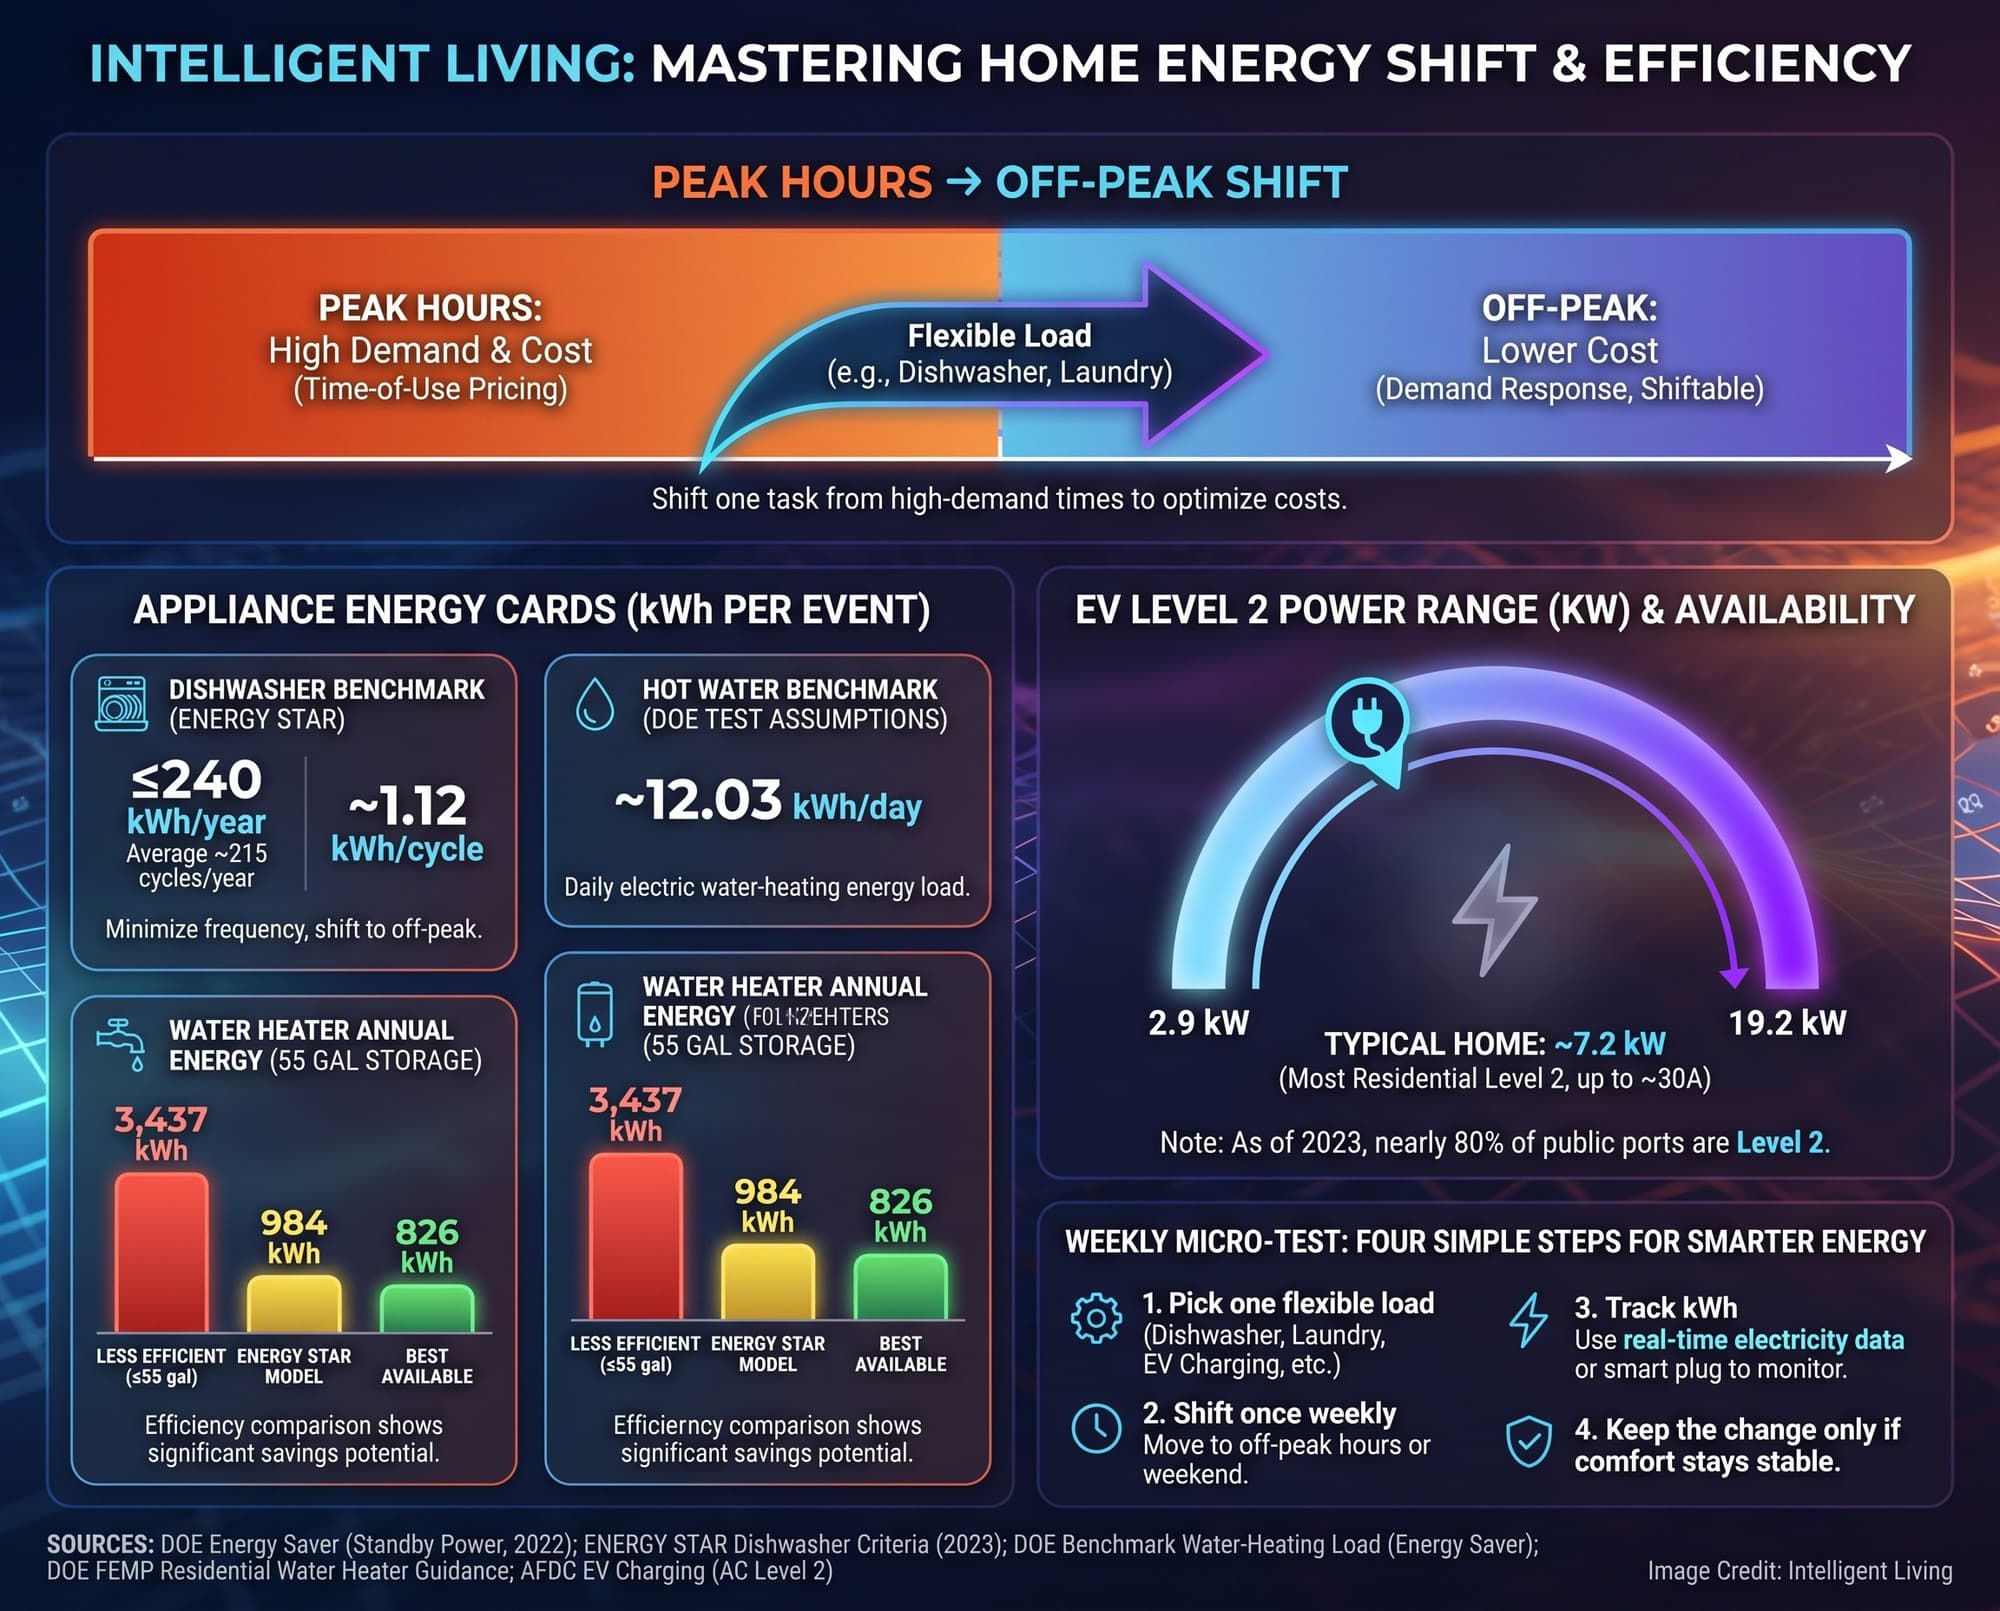
Time-of-use pricing, often abbreviated as TOU, charges higher rates during peak hours and lower rates overnight or during midday valleys. Under shifting loads to cheaper windows via TOU scheduling, the same dishwasher cycle can cost significantly less at 10 p.m. than at 6 p.m., even though the machine does the identical job.
A Weekly Peak-Hour Micro-Test that Doesn’t Start with Comfort Sacrifices
Pick One Flexible Load Before Touching Heating or Cooling
Initiate a four-week peak-hour micro-test by isolating a single flexible load to track the impact of shifted energy consumption. Pick one flexible activity and move it outside the highest-priced window for one week. Track the difference in kWh using the smart meter app.
Your schedule will work even better if you stop wasting power in the background. Focus on ‘vampire’ appliances that stay plugged in and those hidden air leaks that structural energy efficiency upgrades are built to fix.
Flexible chores like laundry or charging your EV represent the best opportunities for shifting usage, and the evening surge from synchronized plug-ins is one reason electric vehicle load management keeps showing up in grid conversations.
Integrating Smart Home Technology for Efficient Climate Control
Comfort-related systems like heating and cooling can come later, if at all. When automation does enter the picture, smart thermostats and efficiency-focused home upgrades can reduce wasted runtime while still keeping rooms stable.
Pre-cooling is a real load-shifting strategy, but it has tradeoffs. Lawrence Berkeley National Laboratory modeling on pre-cooling building thermal mass shows that these strategies can reduce peak demand while increasing total annual cooling energy use, depending on strategy and climate.
A home that normally runs laundry Sunday evening can learn more from a clean swap than from a complicated plan. Move the same load to late Saturday, check whether peak-period kWh dropped, and keep the change only if it improves the numbers without creating hassle.
Why Smart Meter Messages Backfire and What Changes Next for Utilities
Why Some Feedback Backfires
How Social Usage Comparisons Drive Household Energy Choices
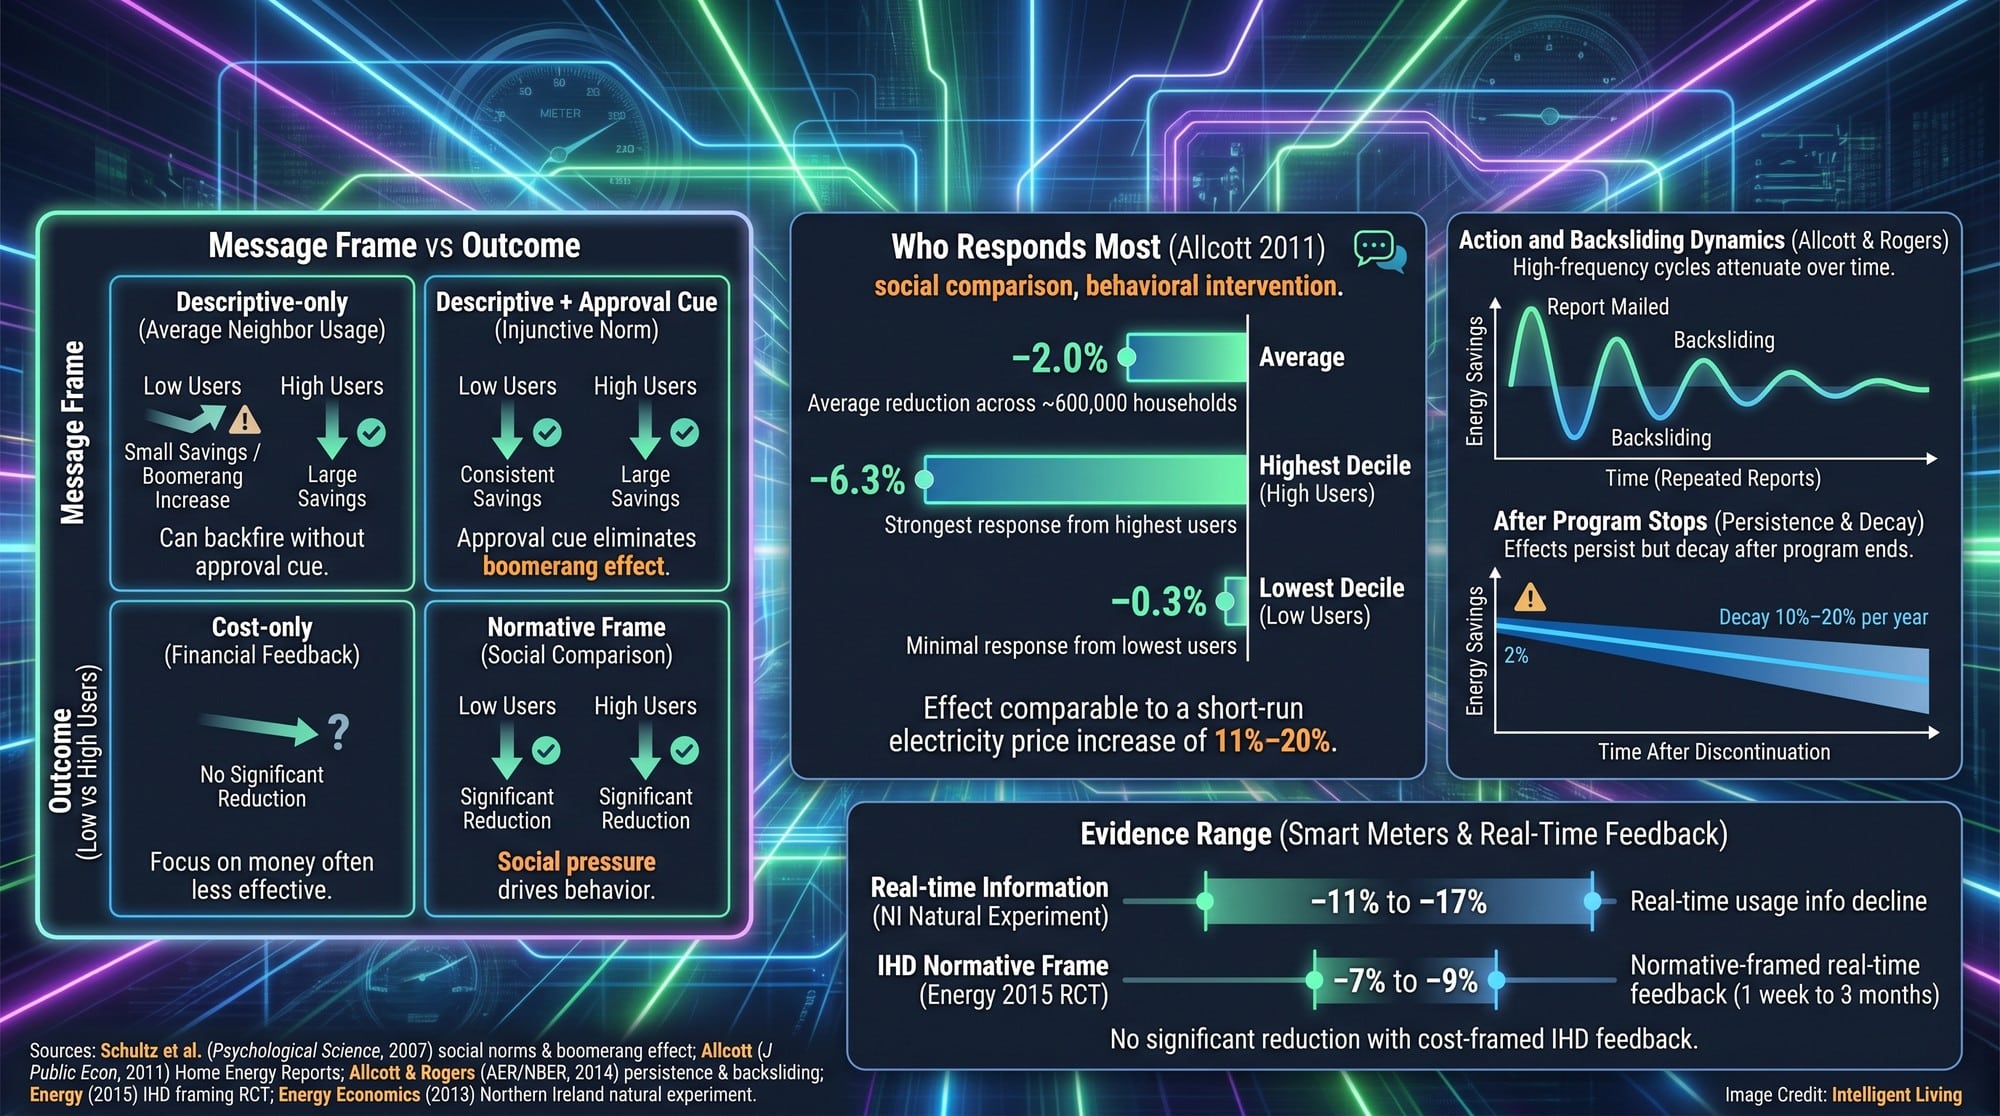
Social comparison feedback frequently triggers a behavioral shift for families starting below the community average. Excessive reassurance often dampens the motivation to reduce energy consumption.
Behavioral economists have documented that social comparison influences energy use. In large field experiments, peer comparison feedback reduced residential energy usage by a measurable amount on average, with stronger effects among higher-usage households.
Overcoming Habit Backsliding for Persistent Energy Savings
Long-term analysis shows that energy-saving effects can persist after a program ends, though they gradually diminish over time. Consistent reinforcement is vital for maintaining active demand response habits.
Evidence from repeated feedback programs points to intermittent habit formation cycles, where households respond right after a report or alert, then drift back toward old habits until the next reminder arrives. The same study also finds that effects can remain after programs stop, but they gradually decay, which is why timing and repetition matter.
What this Changes Next (Rates, Apps, and Grid Planning)
Tailoring Personalized Energy Alerts for High-Consumption Residents
Utilities expanding smart meter deployments should avoid assuming uniform savings. Pricing design, message framing, and the app experience matter, especially when a small behavior shift can keep a household from crossing into a more expensive tier.
If high-usage households drive the majority of reductions, targeting those segments with tailored alerts and clearer bill forecasting can yield stronger results. That is also where the study suggests “optimization error” is likely larger, because heavy users have more uncertainty to correct during a billing period.
Future-Proofing Electrical Readiness for Full Home Electrification
Grid modernization efforts rely on modernizing energy distribution networks that integrate digital measurement, flexible loads, and clear financial incentives rather than just physical infrastructure.
As electrification grows and more homes adopt electric vehicles and heat pumps, peak demand patterns may intensify. Household planning that accounts for panel capacity and high-draw devices is part of that shift, and home electrification electrical readiness upgrades turn load management into a practical planning issue instead of a niche conversation.
Actionable Strategies for Optimizing Residential Smart Meter Performance
Actionable Steps to Optimize Your Smart Meter Data Today
Smart meters do not automatically lower electricity bills. For households with high baseline usage, real-time feedback can trigger meaningful reductions. For already efficient homes, results can vary, and reassurance can sometimes push usage in the wrong direction.
A simple next step is a four-week peak-hour micro-test focused on one flexible load. Track kWh before and after, and keep the change only if it improves results without adding friction.
Start with small adjustments like air sealing and water-heating tweaks common in lowering utility costs through home improvements without turning daily life into a negotiation.
Smart Meter Savings, Peak Hour Strategy, and What The Research Really Means
The emerging evidence shows that smart meter feedback is a tool, not a guarantee. It amplifies existing habits and incentives. High users may see clearer reductions. Low users may see reassurance rather than restraint.
A helpful way to think about the study is that it measures adjustment, not morality. Households move toward what feels optimal once uncertainty drops, which can mean cutting back or loosening up depending on the starting point.
Peak-hour timing matters even more in homes with solar, because rooftop panels often produce strongest at midday while homes use most in the evening. That mismatch is why solar battery backup systems are designed to shift energy across the day instead of letting clean generation and peak demand miss each other.
Maximizing Household Energy Flexibility for Long-Term Efficiency
Achieving consistent results with advanced metering infrastructure requires transitioning from passive observation to active grid flexibility management. By utilizing real-time energy data to identify peak-hour spikes, you can deploy targeted demand response tactics that protect your budget during high-tariff periods. Focus on the high-draw appliances that move the needle on your electric bill, ensuring your home operates as a smart node within the broader utility network.
Taking control of your energy consumption doesn’t have to be a full-time job. Use the Power Planner app to set automated alerts that trigger when you approach expensive pricing tiers, allowing you to pivot your usage before the month ends. This proactive stance turns a digital meter from a simple reporting tool into a strategic asset for household efficiency.
Smart Meter and Peak Hour FAQ: Demand Response and Time-of-Use Questions
Do Smart Meters Actually Save Money?
Not automatically. They provide the interval data needed to identify waste, but actual savings depend on how you adjust your energy consumption based on that feedback.
Why is My Electric Bill So High After Getting a Smart Meter?
If you were already a low-usage household, seeing positive feedback can sometimes lead to the ‘boomerang effect,’ where you unintentionally use more electricity because your bill feels safely low.
What are Peak Hours for Electricity?
Peak hours are high-demand periods, typically late afternoon and early evening, when energy consumption surges and utilities often charge higher time-of-use (TOU) rates.
How Does Demand Response Work for My Home?
Demand response involves shifting electricity usage away from peak hours to off-peak times. This helps stabilize the grid and can lower your bill if you are on a time-variable pricing plan.
What is The Easiest Thing to Shift Off-Peak?
Flexible, high-draw appliances like dishwashers, clothes dryers, and electric vehicle chargers are the easiest loads to schedule for late-night or early-morning off-peak windows.


